E-Commerce Monitoring: The KPIs That Actually Predict Revenue
Table of Contents+
- Why Are Most E-Commerce Dashboards Useless?
- What Are Leading vs Lagging KPIs in E-Commerce?
- Which 5 KPIs Should You Monitor in Real Time?
- How Do You Build a Conversion Funnel That Catches Problems?
- What Does Revenue Attribution at the Feature Level Look Like?
- How Does Page Speed Actually Affect Revenue?
- What Tools Do You Need for E-Commerce Monitoring?
- References
TL;DR
The e-commerce dashboards most teams rely on track revenue, order count, and average order value. These are lagging indicators - they tell you what already happened. By the time revenue drops on your Monday morning report, the problem has been bleeding conversions since Friday.
Key Takeaways
- •Most e-commerce teams monitor lagging KPIs (revenue, orders, AOV) that report what already happened. Leading KPIs (page speed, error rates, funnel drop-offs) predict revenue problems before they hit the P&L.
- •A 1-second delay in page load time reduces conversions by 7% and increases bounce rate by 11% - page speed is the highest-leverage leading KPI in e-commerce.
- •Real-time monitoring of checkout error rates catches payment integration failures, API timeouts, and JavaScript errors that silently kill conversion for hours before anyone notices.
- •Revenue attribution at the feature level - not just the channel level - lets you measure whether a new recommendation engine or checkout redesign actually moved the needle.
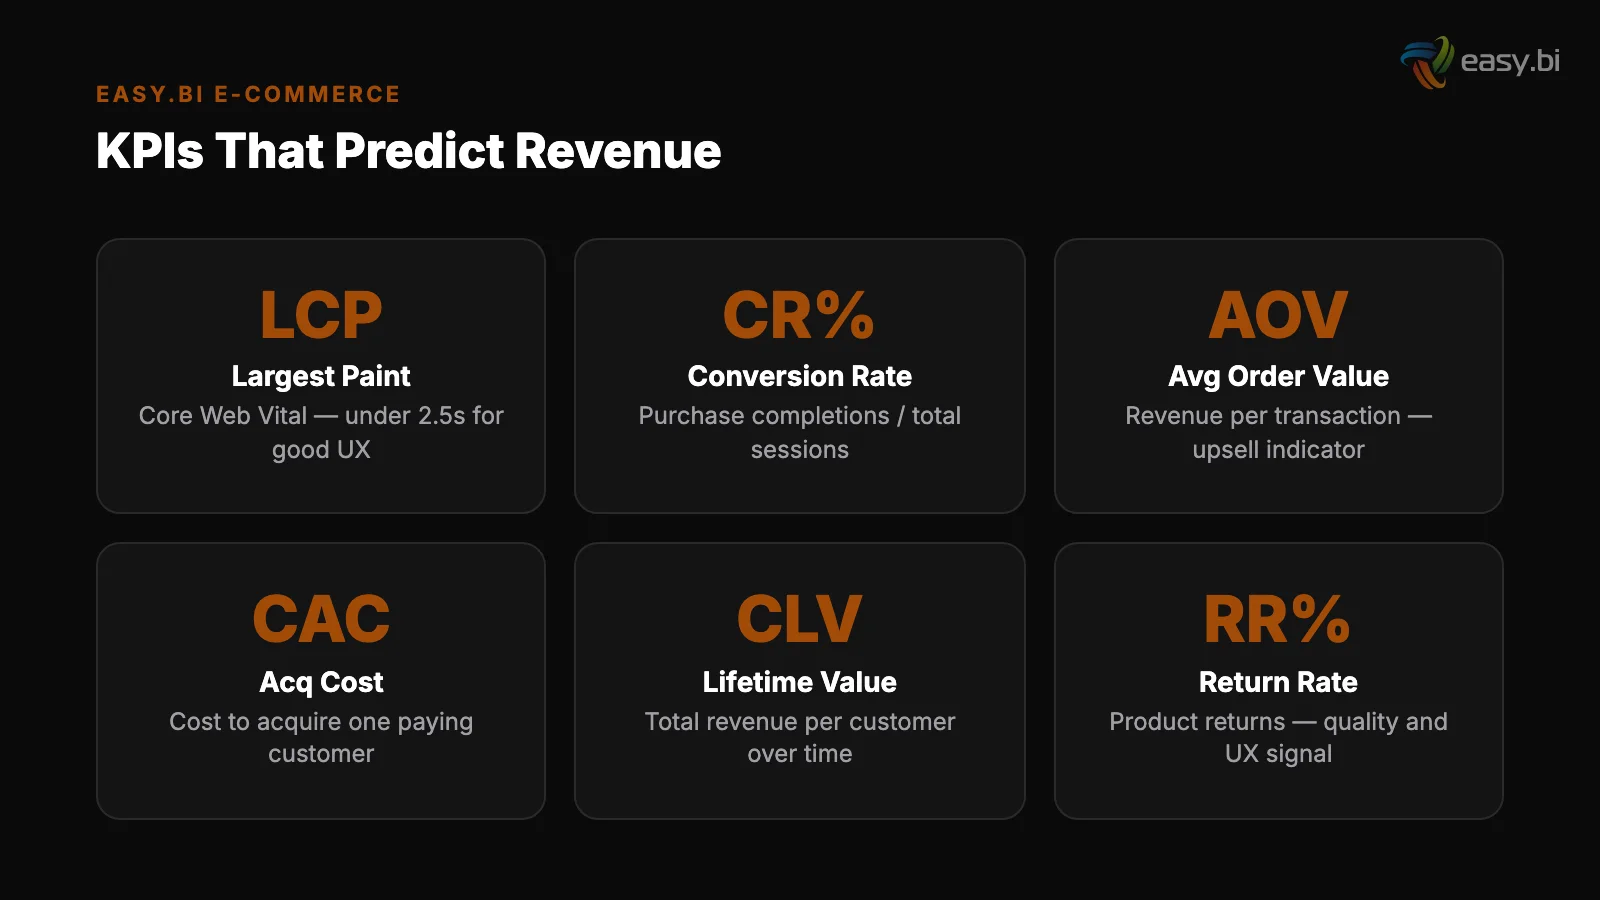
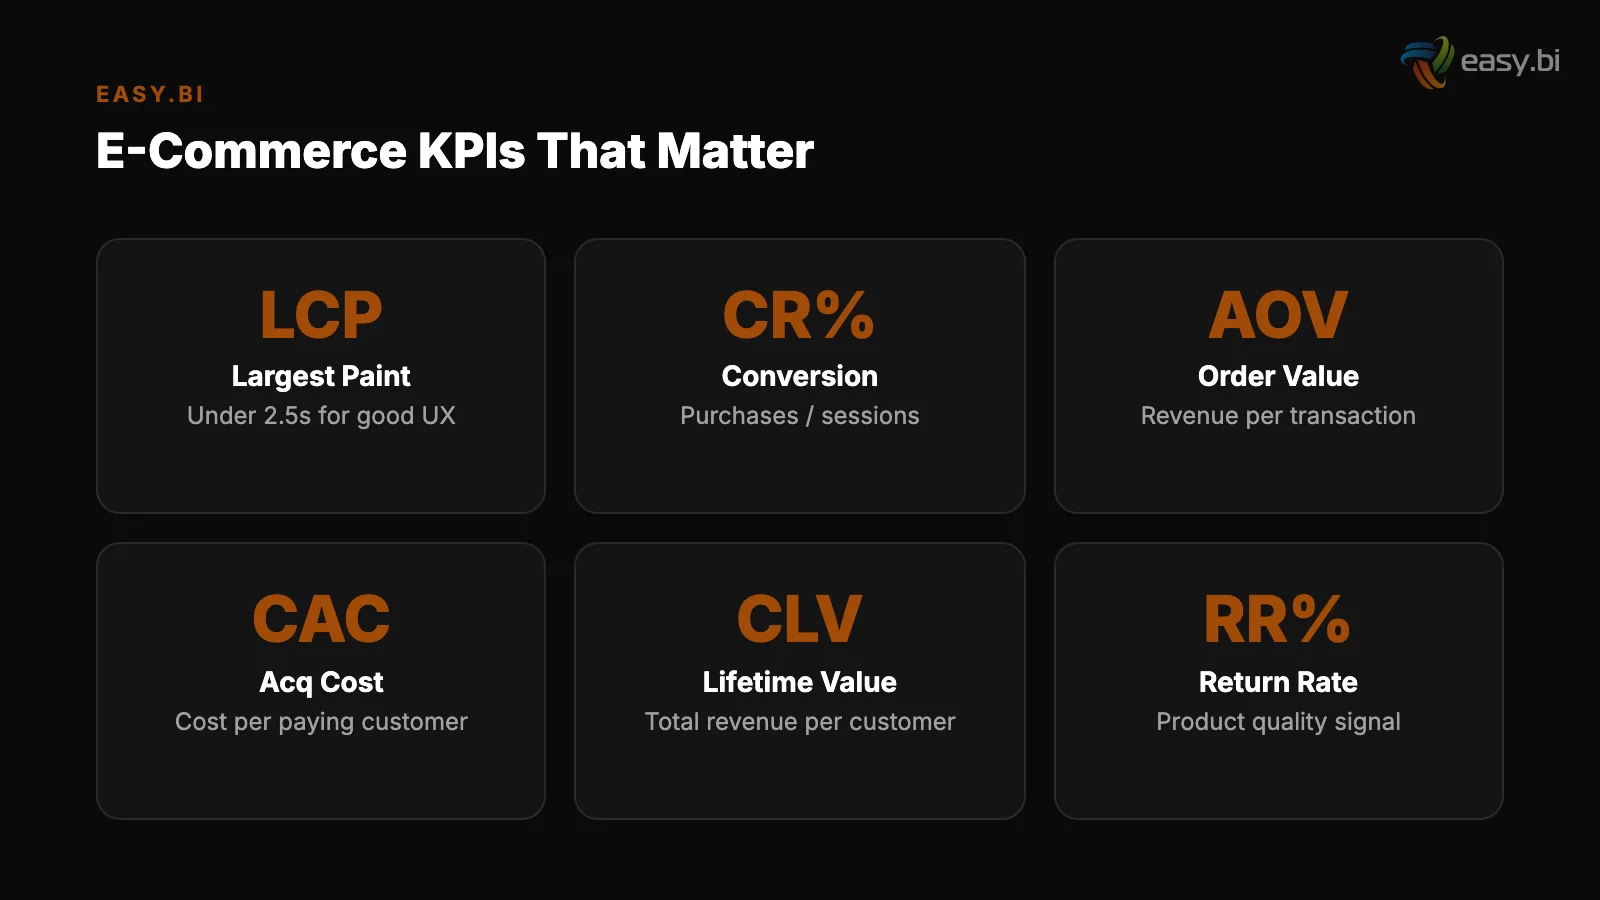
- •The 5 KPIs that matter most for e-commerce monitoring are: Core Web Vitals, checkout completion rate, error rate by page type, add-to-cart rate, and server response time (TTFB).
Most e-commerce dashboards track lagging KPIs that tell you what already happened. Learn the leading indicators - page speed, funnel drop-offs, error rates - that predict revenue before it is lost.
The e-commerce dashboards most teams rely on track revenue, order count, and average order value. These are lagging indicators - they tell you what already happened. By the time revenue drops on your Monday morning report, the problem has been bleeding conversions since Friday.
The KPIs that actually protect revenue are leading indicators: page speed, checkout error rates, funnel drop-off points, and server response times that predict problems before they become losses.
After building monitoring systems for REWE, Fressnapf, ZooRoyal, and dozens of DACH e-commerce operations, we have identified the specific metrics that separate teams who react to revenue drops from teams who prevent them.
Why Are Most E-Commerce Dashboards Useless?
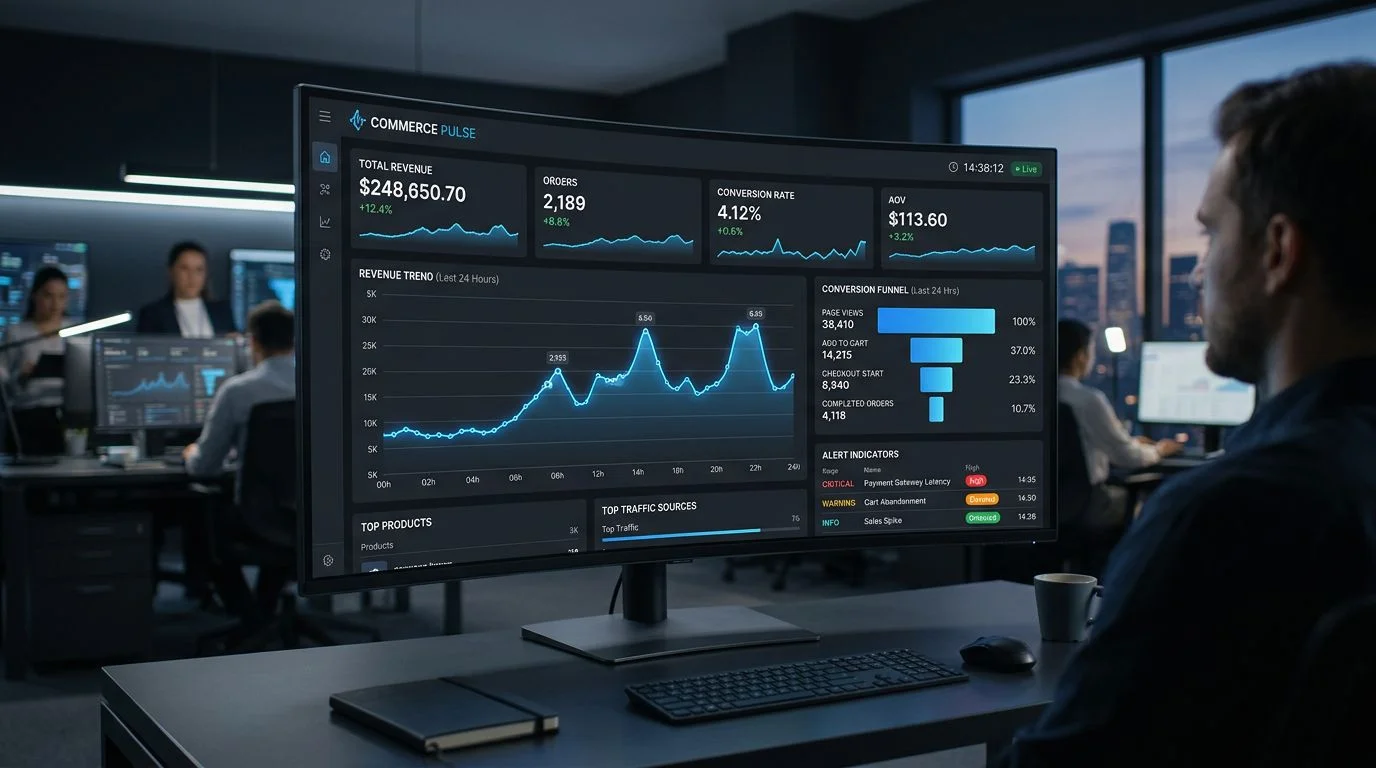
The standard e-commerce analytics setup - Google Analytics, maybe a Shopware dashboard, maybe a BI tool pulling from the data warehouse - answers one question: "What happened?" Revenue was up 12% last month. Conversion rate was 2.9%. Cart abandonment was 68%. These numbers are useful for board reports.
They are useless for operational decisions.
The average e-commerce conversion rate across all industries is 2.86%, with top-performing stores achieving 5.2% or higher.[1] The gap between 2.86% and 5.2% is not strategy - it is execution. Top performers monitor different metrics, monitor them in real time, and act on them within hours, not weeks.
They are aggregated
Lagging KPIs have three fatal flaws for operational monitoring:
They are aggregated. A 3% conversion rate tells you nothing about where conversions are being lost. Is it the product page? The cart? The checkout? The payment step? Aggregated metrics hide the specific breakdowns that you can actually fix.
They are delayed
They are delayed. Most analytics platforms update daily. Some update hourly. Neither is fast enough to catch a payment provider outage at 2 PM that kills checkout for 4 hours.
At EUR 5,000+ per hour in revenue for a mid-market shop, that is EUR 20,000 lost before anyone opens a dashboard.
They are noisy. Revenue fluctuates with day of week, time of day, promotions, weather, and competitor activity. Separating signal from noise in a daily revenue chart requires weeks of data. You need metrics that change only when something in your system changes - not when it rains in Munich.
See how our team delivers +35% avg conversion lift across 30+ e-commerce projects.
What Are Leading vs Lagging KPIs in E-Commerce?
Leading KPIs predict future revenue performance. Lagging KPIs report past performance. The distinction is operational, not academic.
| KPI | Type | What It Tells You | Response Time |
|---|---|---|---|
| Revenue | Lagging | How much you earned | Too late |
| Order count | Lagging | How many transactions completed | Too late |
| Average order value | Lagging | Basket size trends | Daily review |
| Core Web Vitals (LCP, FID, CLS) | Leading | User experience quality | Real-time |
| Checkout completion rate | Leading | Payment/form friction | Hourly |
| Error rate by page type | Leading | Technical failures | Real-time |
| Add-to-cart rate | Leading | Product page effectiveness | Hourly |
| TTFB (Time to First Byte) | Leading | Server/infrastructure health | Real-time |
| Cart abandonment rate | Mixed | Checkout friction or pricing issues | Daily |
| Search-to-product click rate | Leading | Search relevance quality | Daily |
The leading KPIs in this table share one critical property: they change before revenue changes. When your Largest Contentful Paint degrades from 1.8 seconds to 3.2 seconds, conversions will drop - guaranteed.
A 1-second delay in page load time reduces conversions by 7% and increases bounce rate by 11%.[2] If you are monitoring LCP in real time, you catch the degradation and fix it before it costs revenue.
If you are monitoring daily revenue, you see the impact 24 hours later and spend another 24 hours diagnosing the cause.
Which 5 KPIs Should You Monitor in Real Time?
Not every metric needs real-time monitoring. Real-time dashboards create alert fatigue when they track too many signals. These 5 metrics deserve continuous monitoring with automated alerting:
1. Core Web Vitals (LCP, FID/INP, CLS). Google uses these as ranking signals, but their operational value is even higher. LCP above 2.5 seconds means your hero images, product carousels, or fonts are loading too slowly. INP above 200ms means JavaScript is blocking user interactions.
CLS above 0.1 means elements are shifting after load, causing misclicks. Monitor these with synthetic tests (running every 5 minutes from key DACH regions) and real user monitoring (RUM) from actual visitor sessions.
The average mobile e-commerce page loads in 8.6 seconds - 53% of mobile users abandon a site that takes more than 3 seconds.[3]
1. Core Web Vitals (LCP, FID/INP, CLS)
2. Checkout completion rate. The percentage of users who start checkout and complete a purchase. The cart abandonment rate of 70.19% is the headline number everyone knows.[4] But the actionable metric is step-by-step completion: How many drop off at the address form? At shipping selection? At payment?
A sudden 15% drop in payment step completion usually means a payment provider API is returning errors - and it needs a fix within the hour, not a retrospective next week.
3. Error rate by page type. JavaScript errors, API errors, and server errors segmented by page type: homepage, category page, product detail page, cart, checkout, and order confirmation. A 5% JavaScript error rate on product pages might be a broken image gallery.
A 2% API error rate on checkout is a revenue emergency. Segment errors by page type so you know where to look, and by device/browser so you can reproduce.
2. Checkout completion rate
4. Add-to-cart rate. The percentage of product page visitors who add an item to the cart. This is the earliest behavioral signal that something is wrong with your product experience.
If add-to-cart rate drops 20% after a deployment, the new product page layout, a broken size selector, or missing product images are likely culprits. Monitor this hourly, segmented by product category and device type.
5. Server response time (TTFB). Time to First Byte measures how long your server takes to respond to a request. For a Shopware 6 shop on Kubernetes, healthy TTFB is under 200ms. For a headless frontend on Vercel or Netlify, healthy TTFB is under 50ms.
When TTFB spikes, everything downstream degrades: LCP increases, INP suffers, and users bounce. TTFB problems usually point to database queries, cache misses, or infrastructure scaling issues.
How Do You Build a Conversion Funnel That Catches Problems?
Real-time KPI monitoring catches system-level problems. Funnel analysis catches user-experience problems. You need both.
A proper e-commerce conversion funnel has at least 8 stages, not the 4-step oversimplification that most analytics tools default to:
- Session start - visitor lands on any page
- Product view - visitor views a product detail page
- Add to cart - visitor adds at least one item
- Cart view - visitor opens the cart page
- Checkout start - visitor enters the checkout flow
- Address complete - visitor fills shipping/billing details
- Payment selection - visitor chooses a payment method
- Order confirmation - purchase complete
The drop-off between each stage tells you a different story. A high drop-off between product view and add-to-cart suggests pricing, product information, or trust issues. A high drop-off between address and payment suggests a complicated form or missing payment options.
Payment method availability directly impacts conversion - offering local payment methods (SEPA, Sofort, Giropay) increases DACH conversion rates by 12%.[5]
Review the funnel daily. Compare weekday vs weekend patterns. Compare mobile vs desktop. When a specific stage shows a significant drop compared to its 7-day rolling average, investigate immediately.
What Does Revenue Attribution at the Feature Level Look Like?
Channel-level attribution - how much revenue came from organic search vs paid ads vs email - is table stakes. Feature-level attribution answers a harder and more valuable question: Did that specific product recommendation engine, checkout redesign, or search improvement actually generate revenue?
Feature-level attribution requires three things:
Feature flags with analytics integration
Feature flags with analytics integration. When you deploy a new recommendation widget behind a feature flag, the flag system records which users saw the new widget and which saw the old one. This is your experiment group assignment.
Connect it to your conversion data, and you can measure the revenue lift (or drop) per feature.
Holdback groups. Even after you fully roll out a feature, keep 5-10% of users on the old experience for 2-4 weeks. This ongoing comparison validates that the feature continues to perform and helps you detect slow-moving negative effects that A/B tests miss.
Statistical discipline. Do not call a winner after 2 days of data. For a mid-market shop with 50,000 monthly visitors, you need 2-3 weeks of data to detect a 5% conversion lift with statistical significance. For a 1% lift, you need 8-12 weeks.
Most teams declare victory too early and deploy changes that were noise, not signal.
+35% conversion. +22% AOV. EUR 50M+ GMV processed.
Our Shopware-certified team delivers e-commerce at scale with 14-day sprint cycles. 80% less manual work through system integrations.
Start with a Strategy CallHow Does Page Speed Actually Affect Revenue?
Page speed is not a vanity metric. It is the most directly measurable predictor of e-commerce revenue. The data is unambiguous.
The average e-commerce site loads 88 third-party scripts, contributing to 3.2 seconds of additional page load time.[6] Every one of those scripts - analytics tags, retargeting pixels, chat widgets, review platforms - adds latency. And latency directly reduces revenue.
Here is the math for a mid-market DACH shop doing EUR 200,000 per month in revenue with 70,000 monthly sessions:
- Current LCP: 3.5 seconds. Conversion rate: 2.8%.
- Target LCP: 2.0 seconds (1.5-second improvement).
- Expected conversion lift: 7% per second x 1.5 seconds = 10.5% lift.
- New conversion rate: approximately 3.1%.
- Monthly revenue impact: EUR 21,000 additional revenue.
- Annual impact: EUR 252,000.
That is a quarter million euros in annual revenue from page speed alone. And the fix - optimizing images, deferring non-critical scripts, implementing proper caching, upgrading hosting - typically costs EUR 15,000-30,000 in engineering time. The ROI is 8-17x in year 1.
If you are spending EUR 50,000 per month on paid acquisition and your site loads in 4+ seconds, you are paying to drive traffic to an experience that actively repels buyers. Fix the site speed before you increase the ad budget.
What Tools Do You Need for E-Commerce Monitoring?
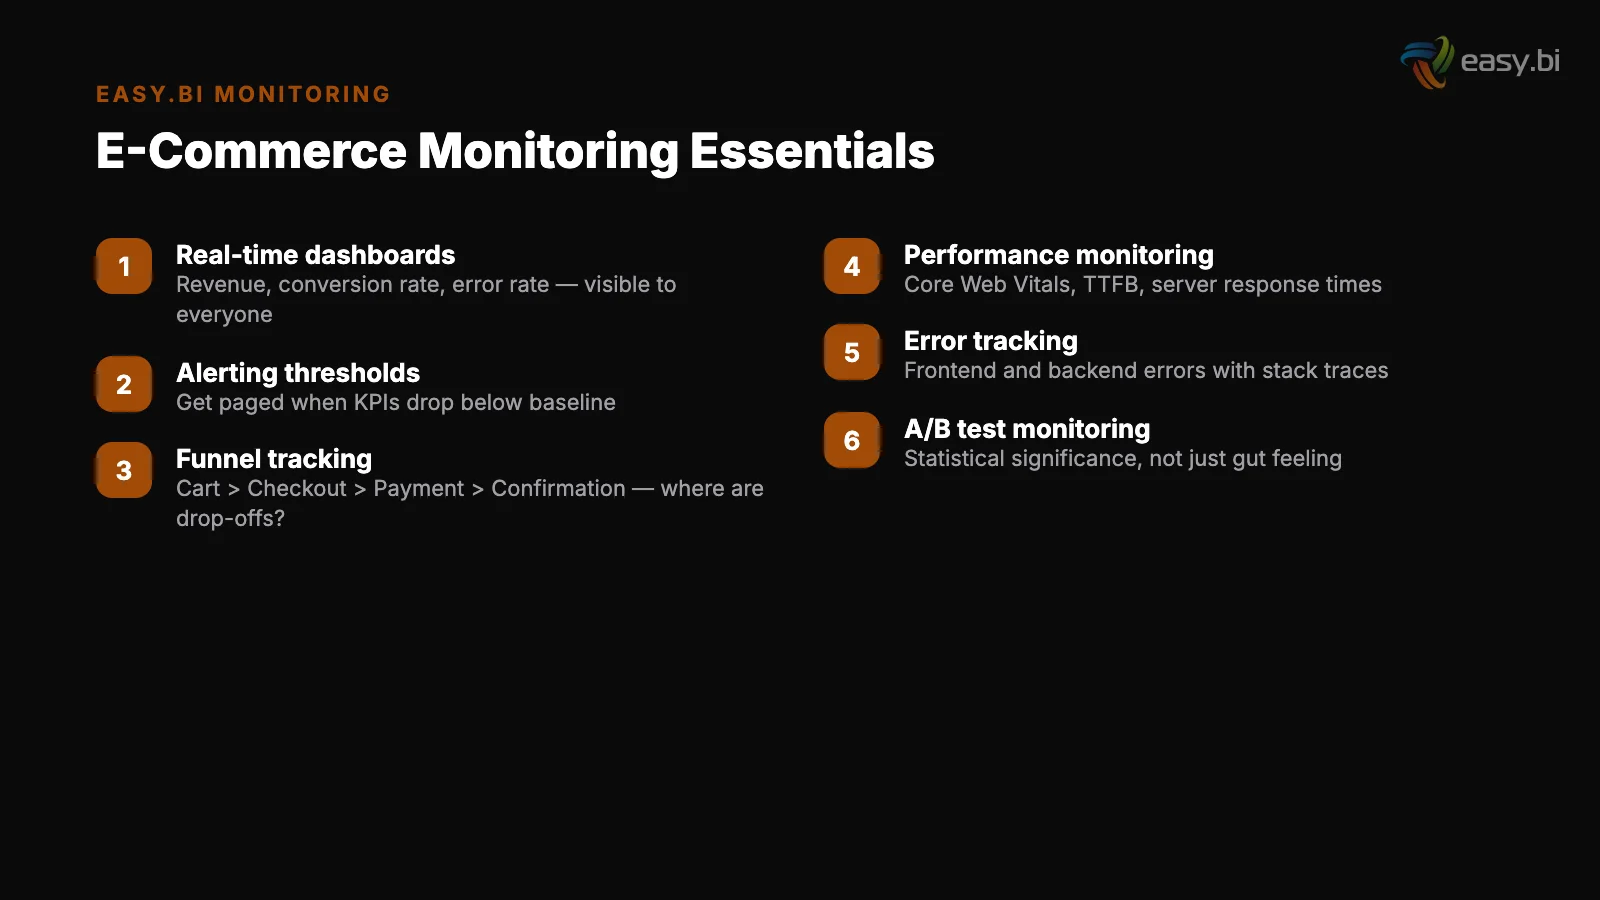
The monitoring stack does not need to be complex. It needs to be focused on the 5 KPIs that matter and deliver alerts within minutes, not hours.
Real User Monitoring (RUM): Collects performance data from actual visitor sessions. Every page load, every interaction, every error - segmented by device, browser, geography, and page type. This is your ground truth for user experience.
Real User Monitoring (RUM)
Synthetic monitoring: Automated tests that hit your key pages every 5 minutes from multiple locations. Synthetic tests catch infrastructure problems (server down, CDN misconfigured, SSL expired) before real users encounter them.
Error tracking: Captures JavaScript errors, API failures, and server errors with full context - stack trace, user session, device, and the sequence of events that led to the error.
A single error in the checkout payment handler might affect 0.5% of transactions - that is hundreds of lost orders per month for a mid-market shop.
Custom dashboards: The 5 real-time KPIs, the 8-stage conversion funnel, and trend comparison (today vs same day last week). One screen. No clicking through 15 tabs to understand the health of your shop.
Synthetic monitoring
For the strategic framework on how monitoring fits into enterprise e-commerce operations, read the Enterprise E-Commerce Playbook. To understand how platform choice affects your monitoring requirements, see Shopware vs commercetools vs Adobe Commerce.
For the sprint delivery cadence that keeps these metrics moving in the right direction, explore How to Run E-Commerce in 14-Day Sprints. And for the data quality foundation that monitoring depends on, see PIM Integration: The Bottleneck Nobody Talks About.
If your e-commerce monitoring is limited to weekly revenue reports and you want to build a system that catches problems before they cost revenue, start with a conversation.
We set up monitoring for shops processing EUR 1 million per month and shops processing EUR 50 million - the KPIs are the same, the thresholds differ.
References
- [1] Statista - Global E-Commerce Conversion Rate Benchmarks (2024)
- [2] Google / Deloitte - Milliseconds Make Millions: Page Speed and Revenue (2023)
- [3] Google - Mobile Page Speed Industry Benchmarks (2023)
- [4] Baymard Institute - Cart Abandonment Rate Statistics (2024)
- [5] Stripe - State of European Payments and Local Methods (2023)
- [6] Akamai - E-Commerce Site Performance and Third-Party Scripts (2023)
Explore Other Topics
Ready to scale your e-commerce?
30-minute call with an engineering lead. No sales pitch - just honest answers about your project.
98% engineer retention · 14-day delivery sprints · No lock-in contracts
Related Reading

E-Commerce Conversion Optimization: The 35% Improvement Framework
A systematic 6-lever framework that delivers +35% conversion rate and +22% AOV for DACH e-commerce. Page speed, checkout, product UX, search, cross-sell, and mobile optimization with measurable benchmarks.
Enno Bassen
The True Cost of Disconnected E-Commerce Systems (ERP, PIM, CRM)
Disconnected ERP, PIM, and CRM systems cost mid-market retailers 80+ hours of manual work per week and 23% in lost revenue. Learn the API-first integration architecture that eliminates data silos.
Enno Bassen
How REWE Runs Multi-Country E-Commerce on 14-Day Sprint Cycles
How enterprise retailers like REWE ship e-commerce features every 14 days. The sprint delivery model, team structure, and QA gates.
Enno Bassen