
The Enterprise E-Commerce Playbook: Architecture, Delivery, and Scale
Table of Contents+
- What Makes Enterprise E-Commerce Different from Mid-Market?
- Platform Architecture: Shopware, commercetools, and Headless
- How Do You Choose the Right E-Commerce Architecture?
- Delivery Methodology: 14-Day Sprints in Practice
- SEO Migration: The Silent Revenue Killer
- PIM Integration: Managing Product Data at Scale
- What Does an Enterprise E-Commerce Team Look Like?
- Monitoring and KPIs That Actually Matter
- How Do You Calculate the ROI of a Platform Migration?
- The REWE Playbook: Enterprise E-Commerce at Scale
- What Separates Failed E-Commerce Projects from Successful Ones?
- Your Enterprise E-Commerce Roadmap
- References
TL;DR
Enterprise e-commerce is not a bigger version of a small online shop. It is a different discipline - with different architecture decisions, different delivery risks, and different team structures. This guide covers the full stack: platform selection, delivery methodology, SEO migration, PIM integration, monitoring, and team design.
Key Takeaways
- •Enterprise e-commerce projects fail at a 60-70% rate - not because of technology, but because of wrong architecture choices, big-bang launches, and multi-vendor coordination breakdowns.
- •Shopware 6 fits DACH mid-market retailers with straightforward requirements. commercetools fits enterprises needing composable, API-first architecture across multiple touchpoints.
- •14-day sprint cycles with working deployments every 2 weeks eliminate big-bang launch risk and deliver 40% more features per quarter than 4-week cycles.
- •SEO migration planning must start before development - not after. A botched migration can cost 30-50% of organic traffic and take 6-12 months to recover.
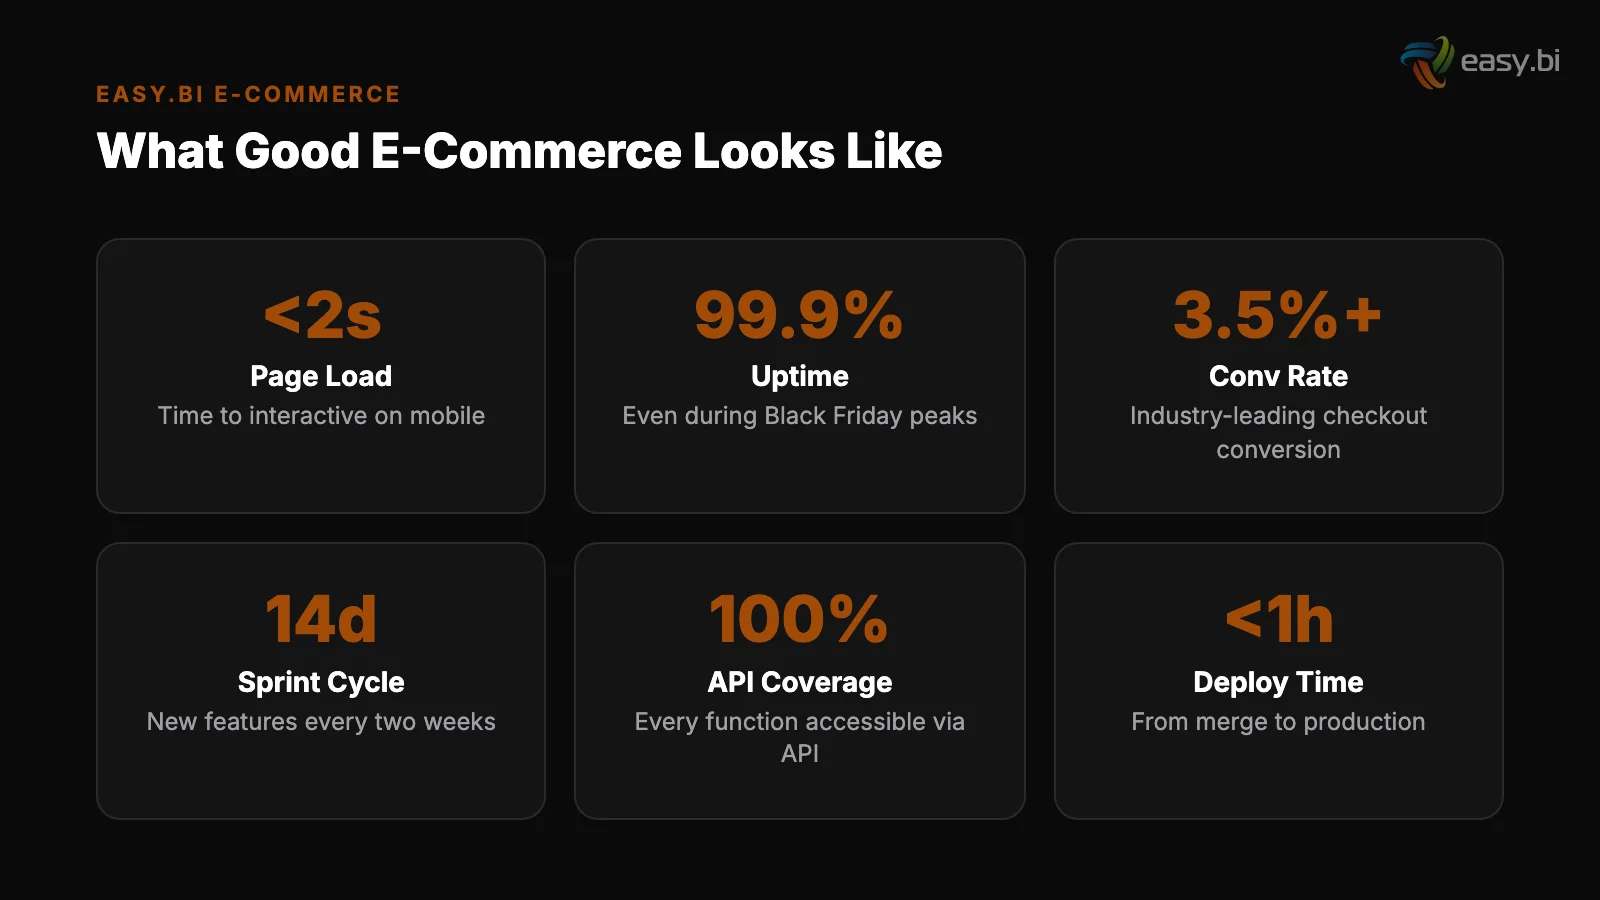
- •The right KPIs for enterprise e-commerce are revenue per session, conversion rate by device, page load time under 2 seconds, and deployment frequency - not vanity metrics like total page views.
The complete enterprise e-commerce guide: platform architecture (Shopware, commercetools, headless), 14-day sprint delivery, SEO migration, PIM integration, and KPIs that drive revenue.
Enterprise e-commerce is not a bigger version of a small online shop. It is a different discipline - with different architecture decisions, different delivery risks, and different team structures. This guide covers the full stack: platform selection, delivery methodology, SEO migration, PIM integration, monitoring, and team design.
Every recommendation is backed by data from 100+ delivered projects across REWE Group, Fressnapf, ZooRoyal, and dozens of DACH mid-market retailers.
What Makes Enterprise E-Commerce Different from Mid-Market?
Enterprise e-commerce operates at a scale where every architectural shortcut compounds. A checkout flow that works for 500 daily orders breaks at 50,000. A PIM integration that handles 2,000 SKUs collapses at 200,000. The difference is not just volume - it is complexity.
The DACH e-commerce market generated EUR 85.4 billion in 2024, growing 3.4% year-over-year after two years of decline.[1] Within that market, enterprise retailers face challenges that mid-market shops never encounter:
- Multi-system integration: Enterprise shops connect to 10-20 backend systems - ERP, PIM, WMS, CRM, loyalty, payment gateways, and marketing automation. Each integration point is a potential failure point.
- Multi-country operations: DACH means three countries, three VAT regimes, different payment preferences (invoice-first in Germany, credit card in Switzerland), and region-specific compliance requirements.
- Organizational complexity: Multiple business units, product teams, and stakeholders competing for roadmap priority. A mid-market shop has one product owner. An enterprise has twelve.
- Legacy constraints: Enterprise retailers rarely start from scratch. They migrate from Magento 1, SAP Hybris, or custom-built platforms carrying 10+ years of business logic, URL structures, and customer data.
These differences explain why 60-70% of e-commerce replatforming projects fail, primarily due to underestimated data migration complexity and insufficient testing.[2] We cover the root causes in detail in Why 70% of E-Commerce Relaunches Fail.
See how our team delivers +35% avg conversion lift across 30+ e-commerce projects.
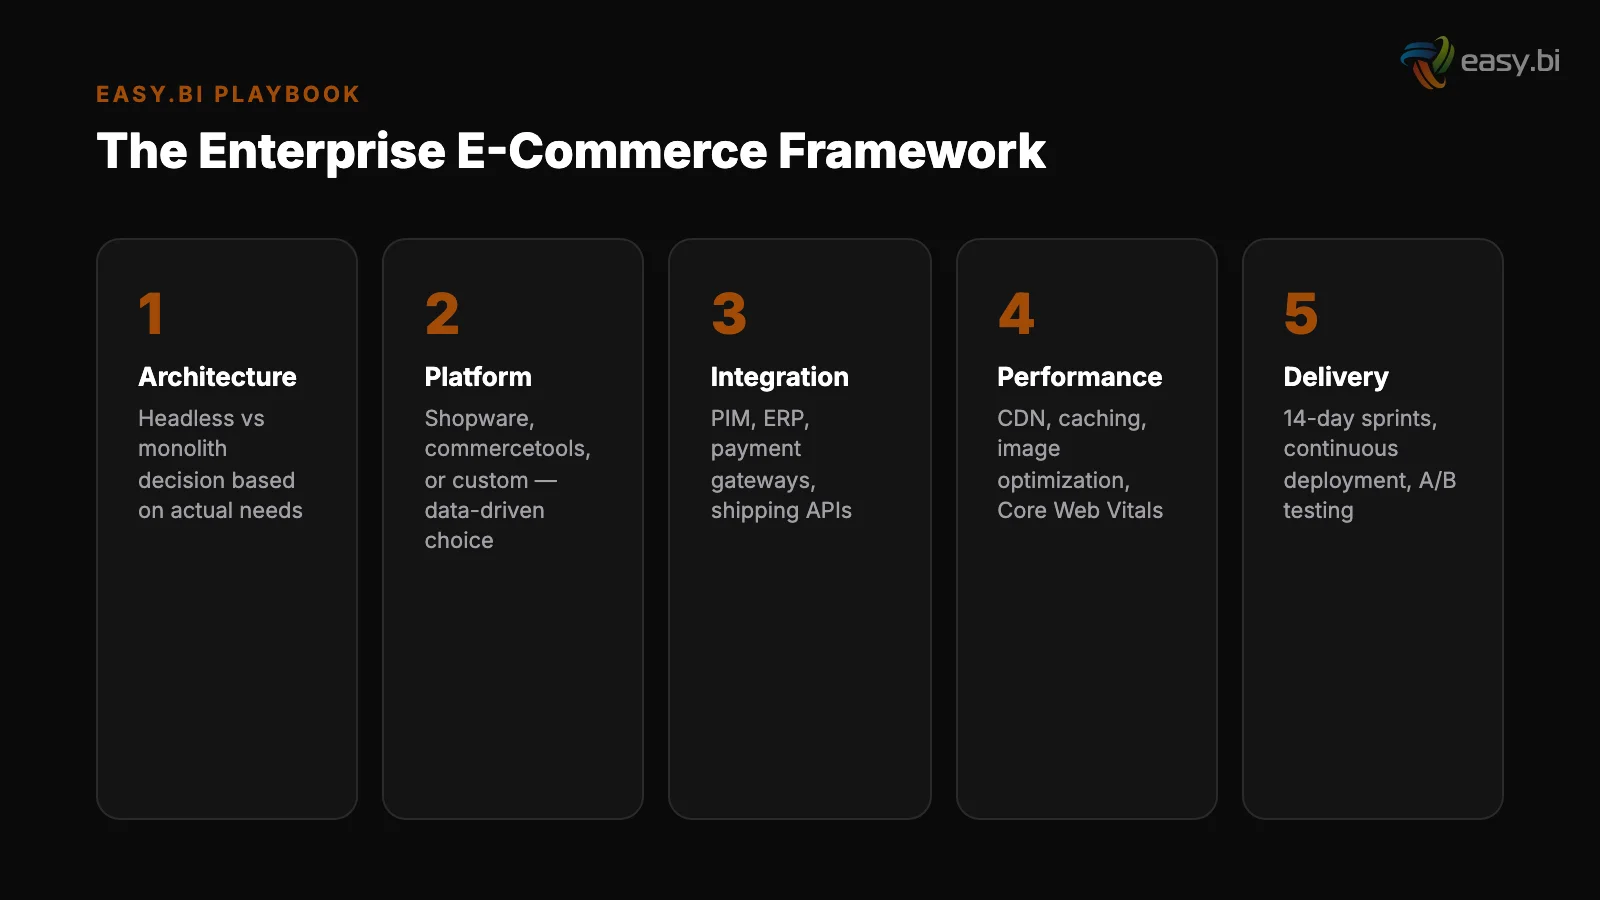
Platform Architecture: Shopware, commercetools, and Headless
Your platform choice determines 80% of your project's risk profile. The wrong platform does not just slow you down - it locks you into compromises that compound over years. Here is how the three main architecture paths compare for DACH enterprise e-commerce.
Shopware 6 for DACH Mid-Market
Shopware 6 is the leading European-origin e-commerce platform, holding approximately 12-15% market share in DACH.[3] It ships with a built-in storefront, admin panel, and plugin ecosystem. For mid-market retailers with a single storefront and standard requirements, Shopware 6 delivers the fastest time-to-value.
Its API-first design also supports headless setups when you outgrow the default frontend.
commercetools for Multi-Brand Enterprise
commercetools leads the headless commerce platform market with 21% share among enterprises adopting composable commerce.[4] It provides commerce APIs - cart, checkout, product catalog, pricing - without any frontend. You build (or buy) every customer-facing layer. This gives maximum flexibility but requires a stronger engineering team.
Headless / composable architecture is not a specific product. It is a pattern where the frontend is decoupled from the commerce engine via APIs. Shopware 6 can run headless. commercetools is headless-native.
The choice is about how much of the stack you want out of the box versus how much you want to compose yourself.
| Factor | Shopware 6 (Standard) | Shopware 6 (Headless) | commercetools |
|---|---|---|---|
| Best for | Single-storefront, DACH mid-market | Multi-frontend, growing enterprises | Multi-brand, multi-country enterprise |
| Time to first launch | 8-12 weeks | 12-16 weeks | 16-24 weeks |
| Team size required | 2-4 developers | 4-6 developers | 6-10 developers |
| Integration complexity | Plugin-based, moderate | API-based, moderate-high | API-first, high |
| Total cost of ownership (3-year) | Lowest | Medium | Higher upfront, lower by year 3 |
| Vendor lock-in | Medium (plugin dependencies) | Low (API layer) | Low (composable by design) |
| DACH ecosystem | Strongest (local agencies, plugins) | Strong | Growing |
We cover the full trade-offs in our dedicated comparison: Shopware vs commercetools vs Adobe Commerce. The short version: Shopware 6 is the right starting point for 70% of DACH enterprise e-commerce projects. commercetools is the right choice when you need multiple storefronts, multiple brands, or extreme customization across touchpoints.
When you are ready to go fully decoupled, see our guide on Headless Commerce: When It's Worth the Complexity.
How Do You Choose the Right E-Commerce Architecture?
Architecture decisions should follow your integration landscape and organizational structure - not your ambition level. The most common mistake is overengineering: choosing composable commerce when a well-configured Shopware 6 instance would deliver value in half the time.
Ask these 5 questions before selecting an architecture:
- How many backend systems need to connect? If fewer than 5, a standard platform setup works. More than 10 systems? API-first / headless reduces integration fragility.
- How many storefronts do you need? One storefront = one platform instance. Multiple brands, B2B + B2C, or multi-country storefronts = headless with shared commerce APIs.
- What is your team's technical maturity? Headless commerce requires frontend engineers who can build and maintain a custom storefront. If your team runs on Shopware plugins today, jumping to commercetools is a 6-month learning curve.
- What is your 3-year scaling trajectory? If you plan to grow from EUR 5M to EUR 50M in online revenue, invest in composable architecture now. If you are optimizing an existing EUR 20M business, improve what you have.
- What is your budget reality? The total cost of ownership for a headless commerce stack is 20-40% higher in year 1 but 30% lower by year 3 compared to monolithic platforms.[5]
61% of German mid-market companies plan to adopt composable commerce architectures by 2026. But planning and executing are different things. The companies that succeed start with a clear integration map, not a technology wish list.[6]
Delivery Methodology: 14-Day Sprints in Practice
The biggest risk in enterprise e-commerce is not picking the wrong platform. It is the big-bang launch - spending 8-12 months building behind closed doors, then flipping the switch on a single day. This approach concentrates all risk into one moment.
Every assumption from month 1 gets tested simultaneously in production.
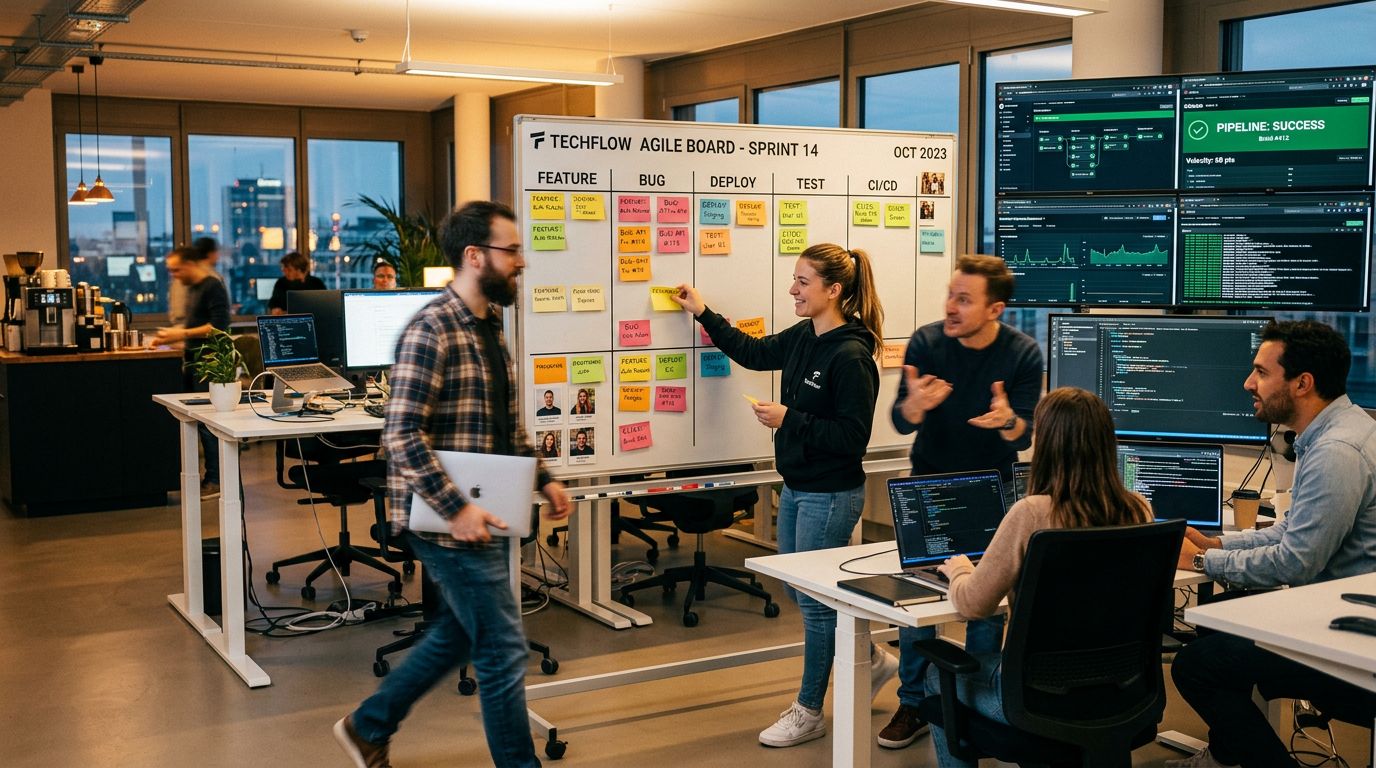
At easy.bi, we use Performance Scrum - a Prince2-based delivery methodology with structured work packages, delivered in 14-day sprint cycles. Every sprint produces a working, deployable increment. This is not theoretical agile. It is the same cadence we use on REWE Group's digital commerce operations.
You can read the full case study in E-Commerce at Scale: Lessons from REWE. For a deeper look at how this sprint cadence works in a live e-commerce environment, see How to Run E-Commerce in 14-Day Sprints Without Breaking Production.
The Sprint Structure
The data backs this approach. Projects using 2-week sprint cycles deliver 40% more features per quarter than those using 4-week cycles.[7]
Here is what a 14-day sprint looks like in an enterprise e-commerce project:
| Day | Activity | Output |
|---|---|---|
| Day 1 | Sprint planning + backlog refinement | Prioritized work packages for the sprint |
| Day 2-3 | Architecture and design | Technical approach + UX designs for sprint scope |
| Day 4-10 | Development + integration | Working code in staging environment |
| Day 11-12 | QA + automated testing | Tested, production-ready code |
| Day 13 | Stakeholder review + acceptance | Approved increment |
| Day 14 | Deployment + retrospective | Live in production + process improvements |
Velocity Stabilization
The key difference from typical agency "agile" is accountability. Each sprint has a defined scope, a dedicated team, and measurable outcomes. You see working software every 14 days - not a status report with green traffic lights hiding red problems.
This cadence also solves the coordination problem that kills multi-vendor setups. When one team owns the entire delivery - frontend, backend, integrations, QA - there are no handoff delays, no finger-pointing, and no integration surprises on launch day.
One detail that most teams underestimate: the sprint velocity stabilizes after 3-4 sprints. The first 2 sprints are slower - the team is calibrating, setting up tooling, and learning the domain. By sprint 3, you have a predictable delivery cadence.
By sprint 6, you can forecast delivery dates with 85%+ accuracy. That predictability is what separates structured sprint delivery from the "we are agile" chaos that most agencies sell.
SEO Migration: The Silent Revenue Killer
SEO migration is the most underestimated workstream in enterprise e-commerce projects. Teams spend months perfecting the new platform, then treat URL redirects as a last-week task. The consequences are immediate: 30-50% organic traffic loss that takes 6-12 months to recover.
The Financial Impact of Failure
A proper SEO migration plan must be finalized before development starts. Here is what it includes:
- Complete URL mapping: Every indexed URL on the old site mapped to its equivalent on the new site. For a shop with 50,000 product pages, this is not a spreadsheet exercise - it requires automated crawling and validation.
- Redirect rules: 301 redirects for every changed URL. No redirect chains. No temporary 302s that become permanent by accident.
- Structured data migration: Product schema, breadcrumb schema, FAQ schema - all must transfer to the new platform without loss.
- Performance budget: A 1-second delay in page load time reduces conversions by 7% and increases bounce rate by 11%.[8] Your new platform must load faster than the old one, not slower.
- Crawl budget optimization: Clean up orphaned pages, broken links, and parameter-heavy URLs before Google tries to recrawl your entire site.
The Dangerous Myth of Automatic Discovery
The financial impact of getting this wrong is severe. A mid-market retailer generating 40% of revenue from organic search can lose EUR 200-400K in the first quarter after a botched SEO migration. Recovering those rankings takes 6-12 months - if you recover them at all.
Some category pages never return to their pre-migration positions because competitors fill the gap while your site is in recovery mode.
The most dangerous SEO migration myth is that search engines will "figure it out." They will not. Google needs explicit signals - clean 301 redirects, valid sitemaps, consistent canonical tags - to transfer authority from old URLs to new ones. Without those signals, your domain authority erodes page by page.
We have seen enterprises lose 60% of their organic traffic within 30 days of a migration that skipped proper redirect mapping.
We cover the full SEO migration process in The SEO Migration Nobody Plans For (Until It's Too Late). The critical takeaway: SEO migration is a technical architecture decision, not a marketing task. It belongs in sprint 1, not sprint 15.
PIM Integration: Managing Product Data at Scale
Product Information Management becomes non-optional once you pass 5,000 SKUs, sell across multiple channels, or operate in multiple languages. PIM adoption among enterprises with 10,000+ SKUs reached 67% in 2023, with Pimcore leading as the open-source option.[9]
Pimcore, Akeneo, and SAP Compared
In the DACH market, the most common PIM integrations for enterprise e-commerce are:
- Pimcore: Open-source, highly flexible, strong in the German-speaking market. Best fit when you need PIM + DAM (digital asset management) + content management in one system.
- Akeneo: Purpose-built PIM with a cleaner UX and faster implementation for pure product data management. Better fit when you only need PIM and already have separate DAM and CMS.
- SAP Master Data Governance: The right choice when SAP is already your ERP backbone and you want a single vendor for data governance.
The One-Direction Data Flow Rule
The integration architecture matters as much as the PIM choice itself. Product data must flow in one direction: PIM is the master, the e-commerce platform is the consumer. Bidirectional sync creates data conflicts that are almost impossible to debug at scale.
The most expensive PIM mistake is not picking the wrong product. It is treating product data as a backend concern. When your PIM integration is an afterthought, you get inconsistent pricing, missing images, and wrong stock levels on your storefront - visible to every customer, every day.
We cover PIM integration patterns and Pimcore setup in detail in PIM Integration: The Bottleneck Nobody Talks About. For now, the rule is simple: if you have more than 5,000 SKUs, plan PIM integration from day 1 of your e-commerce project. Not after launch.
What Does an Enterprise E-Commerce Team Look Like?
Team structure determines delivery speed more than any technology choice. The wrong team shape creates bottlenecks that no platform can fix. Teams of 5-9 people deliver the highest productivity per person; teams larger than 15 see 50% lower per-capita output.[10]
An enterprise e-commerce team at easy.bi typically looks like this:
- Project Owner (1): Owns the backlog, prioritizes work packages, and is accountable for sprint outcomes. This person is your single point of contact.
- Solution Architect (1): Makes platform and integration decisions. Reviews every technical approach before development starts.
- Backend Developers (2-3): Commerce platform, API development, integrations (ERP, PIM, WMS).
- Frontend Developers (1-2): Storefront, checkout flow, responsive design. In headless setups, this team builds the entire customer-facing layer.
- QA Engineer (1): Automated testing, regression testing, performance testing. QA is not an afterthought - it is built into every sprint.
- DevOps (0.5): CI/CD pipelines, infrastructure, deployment automation. Shared across projects but dedicated during critical phases.
The total: 6-8 people for a standard enterprise e-commerce project. This team ships working software every 14 days. For complex multi-brand, multi-country setups, you scale to 2-3 parallel teams - each structured identically, each owning a defined scope.
Cross-functional teams are 35% more productive than siloed teams working on the same type of project.[11] The key is keeping all disciplines - development, QA, architecture - in one team with one backlog.
The moment you split frontend and backend into separate teams with separate backlogs, you create a coordination overhead that slows everything down.
+35% conversion. +22% AOV. EUR 50M+ GMV processed.
Our Shopware-certified team delivers e-commerce at scale with 14-day sprint cycles. 80% less manual work through system integrations.
Start with a Strategy CallMonitoring and KPIs That Actually Matter
Most enterprise e-commerce dashboards track the wrong metrics. For a comprehensive breakdown of which leading indicators predict revenue, see our guide on E-Commerce Monitoring: The KPIs That Actually Predict Revenue. Total revenue and page views tell you what happened.
They do not tell you why it happened or what to do next. Here are the KPIs that drive action.
Revenue and Conversion Metrics
Revenue metrics:
- Revenue per session (RPS): The single most important e-commerce metric. It combines traffic quality, conversion rate, and average order value into one number. If RPS drops, something is broken - and you need to find what.
- Conversion rate by device: Mobile conversion rates average 1.8% in DACH, desktop 3.2%. If your mobile rate is below 1.5%, your checkout has usability issues.
- Cart abandonment rate by step: The average is 70.19% across all industries.[12] But knowing the overall rate is useless. You need to know which step loses the most users - shipping calculation, payment selection, or account creation.
Technical and Business Metrics
Technical metrics:
- Core Web Vitals: LCP under 2.5 seconds, FID under 100ms, CLS under 0.1. Google uses these as ranking signals. Your customers use them as patience thresholds.
- Deployment frequency: How often you ship to production. Elite DevOps performers deploy 973x more frequently than low performers.[13] In e-commerce, this translates to faster experimentation and faster bug fixes.
- Error rate: 5xx errors, payment failures, inventory sync mismatches. Set alerts for anything above 0.1%.
Business metrics:
- Customer acquisition cost (CAC): E-commerce CAC increased 60% between 2020 and 2023.[14] If you are not tracking CAC by channel, you are burning budget on channels that stopped converting.
- Return rate by category: German e-commerce return rates average 16.3%, with fashion at 26%. Returns eat margin. Track them by product category and optimize the worst offenders.
How Do You Calculate the ROI of a Platform Migration?
Platform migration ROI is straightforward to calculate but hard to commit to. Most business cases fail because they undercount costs and overcount benefits. Here is the honest math.
Cost side:
- Platform licensing (annual): EUR 0 (open source) to EUR 200K+ (enterprise SaaS)
- Implementation (one-time): EUR 150K-800K depending on scope and architecture
- Data migration: EUR 30K-100K (most teams budget 50% too little for this)
- SEO migration: EUR 15K-40K (skip this at your own risk)
- Post-launch optimization (8 weeks): EUR 40K-80K
- Opportunity cost during migration: 3-6 months of frozen feature development
Benefit side:
- Conversion rate improvement: 10-25% is realistic for a well-executed migration. At EUR 20M annual revenue, a 15% conversion uplift is EUR 3M.
- Reduced total cost of ownership: Composable architecture saves 30% annually by year 3.[5]
- Faster feature delivery: 14-day sprints mean you ship improvements 26 times per year instead of 4 quarterly releases.
- Reduced downtime: Modern platforms with CI/CD pipelines achieve 99.95%+ uptime vs 99.5% for legacy stacks.
The break-even point for most enterprise e-commerce migrations is 12-18 months. That assumes disciplined implementation with incremental delivery - not a 12-month big-bang project that launches late and over budget.
The REWE Playbook: Enterprise E-Commerce at Scale
REWE Group operates one of the largest e-commerce ecosystems in DACH. Their approach to digital commerce is the opposite of a big-bang relaunch. There is no "relaunch" in the traditional sense. The platform evolves every 2 weeks through structured sprints.
easy.bi provides end-to-end shop ownership for REWE Group's digital commerce operations, operating on 14-day sprint cadence. Each sprint has a defined scope, a dedicated team, and measurable outcomes. The result: continuous improvement without the catastrophic risk of a monolithic migration.
Three Principles from the REWE Model
Three principles from the REWE model that apply to every enterprise e-commerce project:
- Continuous delivery over big-bang launches. Ship improvements every 2 weeks. Validate with real traffic. Course-correct based on data, not assumptions.
- Single-partner accountability. One team owns the outcome - frontend, backend, integrations, QA. No finger-pointing between vendors. No coordination overhead eating your budget.
- Business metrics as the definition of done. A sprint is not "done" when the code is deployed. It is done when the business KPI it targeted has moved in the right direction.
This model works because it removes the two biggest risk factors in enterprise e-commerce: the big-bang launch and the multi-vendor coordination problem. When you ship every 2 weeks, there is no single catastrophic launch day. When one team owns the entire stack, there are no integration gaps between vendors.
The REWE approach is not revolutionary. It is disciplined. And discipline beats cleverness in enterprise e-commerce every time.
Fressnapf and the 3C Platform
Fressnapf followed a similar model with their 3C platform (Community, CMS, e-Commerce). Instead of hiring separate agencies for each layer, they chose one integrated team to architect and build the entire platform. The unified team eliminated the coordination overhead that kills most complex e-commerce projects. One backlog.
One definition of done. One team accountable for business outcomes.
Read the full breakdown in E-Commerce at Scale: Lessons from REWE.
What Separates Failed E-Commerce Projects from Successful Ones?
After 100+ e-commerce projects delivered since 2015, the patterns are clear. Failed projects share the same root causes. Successful projects share the same disciplines. Here is what the data shows.
Failed projects:
- Start with technology selection before defining business requirements
- Use the big-bang approach - 8-12 months of development, one launch day
- Split work across 3-4 vendors with no single owner of the outcome
- Treat SEO migration as a post-launch task
- Budget zero for post-launch optimization
- Measure success in delivered features, not business metrics
Successful projects:
- Start with a discovery phase that maps every integration, every data flow, and every business rule
- Ship incrementally - working software in production every 14 days
- Have one accountable team with frontend, backend, QA, and architecture under one backlog
- Plan SEO migration before writing a single line of code
- Reserve 20-30% of total budget for post-launch optimization
- Define success in 3 numbers: target conversion rate, page load time, revenue per session
70% of digital transformations fail to reach their stated goals.[15] That statistic is not about technology. It is about execution discipline. The companies that beat the odds do not use better tools. They use better processes.
Your Enterprise E-Commerce Roadmap
If you are planning an enterprise e-commerce project - replatforming, scaling, or launching from scratch - here is the sequence that works.
Phase 1: Discovery (2-4 weeks). Map your integration landscape. Audit current performance baselines. Define success in 3 measurable KPIs. Decide architecture based on your 5 answers from the architecture section above.
Foundation and Incremental Build
Phase 2: Foundation Sprint (2 weeks). Set up CI/CD pipeline, staging environment, automated testing framework. No customer-facing work yet - this is infrastructure. Skip this phase and you will pay for it in every subsequent sprint.
Phase 3: Incremental Build (8-20 weeks). Ship working software every 14 days. Start with the highest-risk items: checkout, search, product detail pages, and the top 3 integrations. Get real user feedback on staging environments early. Do not save the hard integrations for last.
Parallel Running and Optimization
Phase 4: Parallel Running (2-4 weeks). Run old and new platforms simultaneously. Route a percentage of traffic to the new platform. Compare conversion rates, load times, and error rates. Cut over only when the new platform matches or exceeds every baseline KPI.
Phase 5: Optimization (ongoing). Plan 4-8 weeks of intensive post-launch optimization. Monitor search rankings daily. Fix performance issues within hours. Run A/B tests on checkout, product pages, and navigation. This phase is where the ROI materializes.
easy.bi has delivered 100+ projects with a 98% client retention rate. Our 50+ engineers work in 14-day sprint cycles across Shopware 6, commercetools, and headless architectures. We do not just build platforms - we own outcomes. Explore our e-commerce practice or book an Expert Call to discuss your project.
References
- [1] Bevh / EHI - German e-commerce revenue reached EUR 85.4 billion in 2024
- [2] Forrester - E-commerce replatforming projects have a 60-70% failure rate
- [3] EHI Retail Institute - Shopware holds approximately 12-15% DACH market share
- [4] Gartner - commercetools leads headless commerce with 21% enterprise share
- [5] Forrester - Headless commerce TCO is 30% lower by year 3
- [6] Lünendonk / commercetools - 61% of German mid-market plan composable commerce by
- [7] Scrum.org - 2-week sprints deliver 40% more features per quarter
- [8] Google / Deloitte - 1-second delay reduces conversions by 7%
- [9] Ventana Research - PIM adoption at 67% for 10,000+ SKU enterprises
- [10] QSM / Putnam - Teams of 5-9 deliver highest per-person productivity
- [11] Harvard Business Review / Bain - Cross-functional teams are 35% more productive
- [12] Baymard Institute - Average cart abandonment rate is 70.19%
- [13] DORA / Accelerate - Elite performers deploy 973x more frequently
- [14] SimplicityDX - E-commerce CAC increased 60% between 2020 and 2023
- [15] McKinsey - 70% of digital transformations fail to reach stated goals
Explore Other Topics
Ready to scale your e-commerce?
30-minute call with an engineering lead. No sales pitch - just honest answers about your project.
98% engineer retention · 14-day delivery sprints · No lock-in contracts
Related Reading
How REWE Runs Multi-Country E-Commerce on 14-Day Sprint Cycles
How enterprise retailers like REWE ship e-commerce features every 14 days. The sprint delivery model, team structure, and QA gates.
Enno Bassen
E-Commerce at Scale: Lessons from REWE Group's Continuous Delivery Model
How REWE Group runs enterprise e-commerce with 14-day sprint delivery cycles, zero big-bang launches, and continuous performance optimization. The playbook explained.
Enno Bassen
How can enterprise software solutions improve the management of e-commerce businesses?
Enterprise software enhances retail efficiency, optimizes supply chains, and improves customer experiences, driving long-term business success.
Enno Bassen