
Why Your E-Commerce Analytics Are Lying to You (And How to Fix It)
Table of Contents+
- What Are the 5 Analytics Lies E-Commerce Teams Believe?
- How Does Data Sampling Distort Your Numbers?
- Why Is GA4 Alone Not Enough for DACH E-Commerce?
- What Does a Complete E-Commerce Analytics Stack Look Like?
- What Should You Measure at Each Funnel Stage?
- How Do You Set Up Event Tracking That Actually Works?
- How Do You Build Dashboards That Tell the Truth?
- How Do You Turn Analytics Data Into Decisions?
- What Does Proper Analytics Visibility Actually Deliver?
- References
TL;DR
Your e-commerce analytics dashboard says conversion rate is 2.8%, traffic is up 12% month over month, and the last campaign drove 3,000 new sessions. The numbers look clean. The problem: at least 3 of those data points are wrong. Consent bias is hiding 40-60% of your German traffic. Sampling is smoothing over anomalies.
Key Takeaways
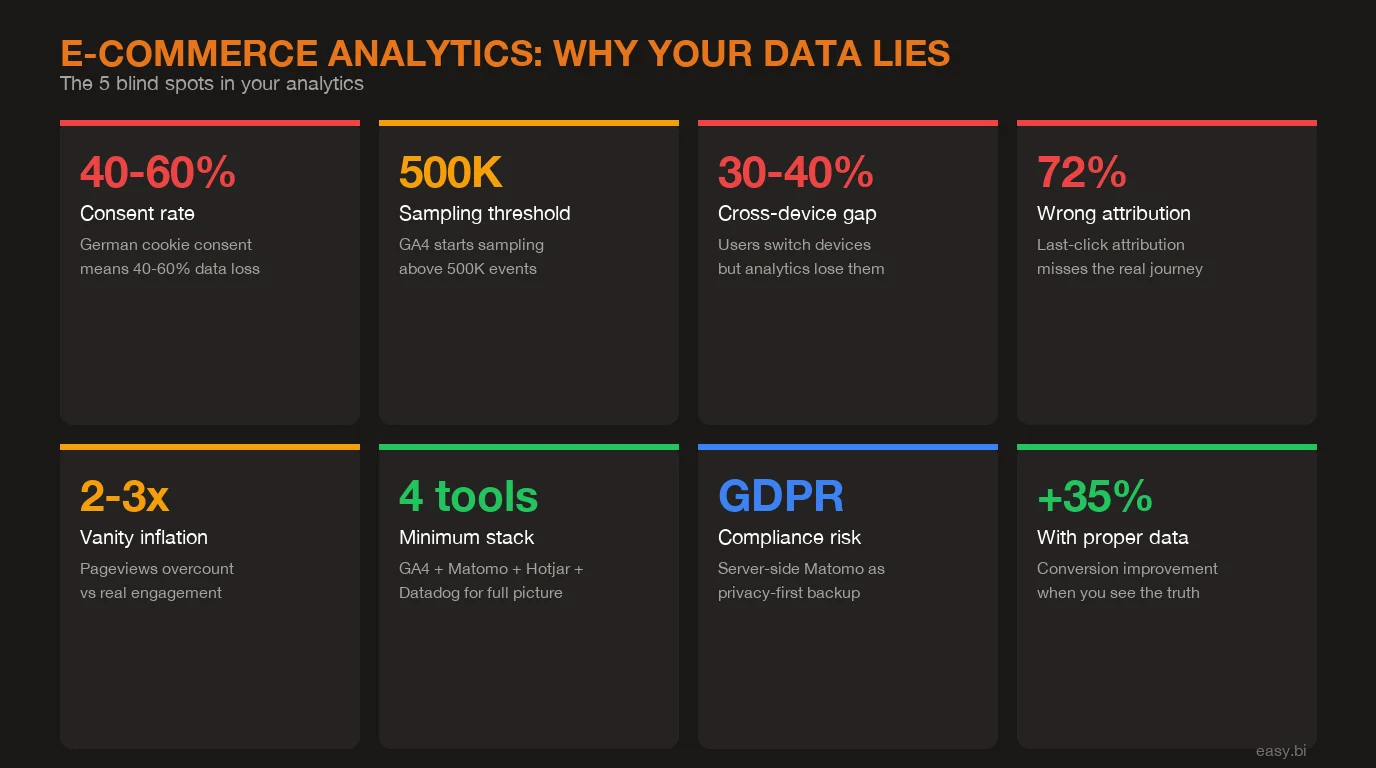
- •Most e-commerce analytics setups suffer from 5 blind spots: vanity metrics, attribution gaps, consent bias, sampling errors, and cross-device blindness. Each one distorts the data your team uses to make revenue decisions.
- •In Germany, cookie consent rates range from 40-60%, meaning GA4 alone misses up to half of your actual traffic. Every decision based on that data is built on an incomplete picture.
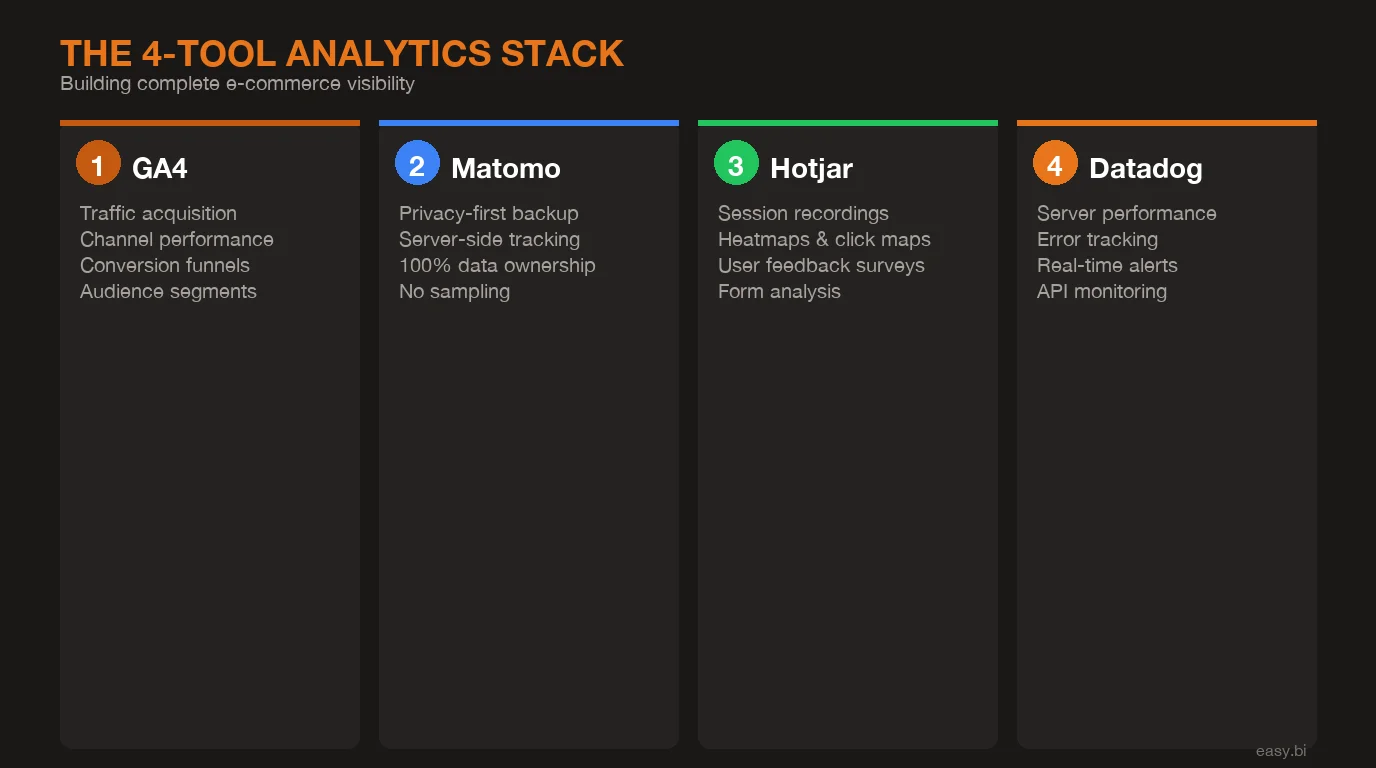
- •A 4-tool analytics stack (GA4 for acquisition, Matomo for privacy-first tracking, Hotjar for behavioral UX data, Datadog for performance monitoring) eliminates the gaps that single-tool setups create.
- •Proper event tracking across the full funnel (acquisition, activation, revenue, retention) enables the kind of data visibility that drives +35% conversion improvements in e-commerce.
- •The goal is not more data. It is a unified view that connects traffic sources, user behavior, technical performance, and revenue outcomes into dashboards that tell the truth and drive decisions.
Most DACH e-commerce teams make decisions on incomplete data. Learn why GA4 alone is not enough, how consent rates distort your numbers, and how to build a 4-tool analytics stack that shows what is actually happening in your store.
Your e-commerce analytics dashboard says conversion rate is 2.8%, traffic is up 12% month over month, and the last campaign drove 3,000 new sessions. The numbers look clean. The problem: at least 3 of those data points are wrong. Consent bias is hiding 40-60% of your German traffic. Sampling is smoothing over anomalies. Attribution is crediting the wrong channels. You are making revenue decisions on data that does not reflect what is actually happening in your store.
This article breaks down the 5 ways e-commerce analytics lie, why a single tool cannot fix the problem, and how to build a 4-tool stack that gives you actual visibility into customer behavior across the full funnel.
What Are the 5 Analytics Lies E-Commerce Teams Believe?
Every analytics setup has blind spots. The danger is not the blind spots themselves. It is that teams do not know they exist, and they optimize based on distorted data. Here are the 5 most common lies hiding in your analytics.
Lie 1: Vanity metrics equal performance. Pageviews, sessions, and time on site are activity metrics, not outcome metrics. A page with 50,000 monthly views and a 0.3% conversion rate is underperforming a page with 5,000 views and a 3.1% conversion rate. Yet most dashboards lead with traffic volume because it is the easiest number to make look good. 53% of marketers say half of their analytics data goes unused because they cannot connect it to business outcomes [1].
The fix is not more data. It is fewer metrics tied directly to revenue: conversion rate per funnel stage, revenue per visitor, and customer acquisition cost by channel.
Lie 2: Attribution tells you what works. Last-click attribution, which GA4 defaults to for most reports, credits the final touchpoint before conversion. A customer who discovered your store through an Instagram ad, returned via an email, and converted through a Google search gets attributed entirely to Google. Your Instagram spend looks like it produces nothing. Multi-touch attribution models are better, but still imperfect. Google's own research shows that the average e-commerce purchase involves 2.6 touchpoints across multiple sessions [2].
No single attribution model captures the full journey. The honest approach is to use multiple models and look at the range, not a single number.
Lie 3: Consent bias skews everything. In Germany, GDPR-compliant cookie consent banners see opt-in rates between 40-60% [3]. That means GA4, which relies on client-side cookies, captures only half your actual traffic. Worse, the half it captures is systematically biased: returning users who know and trust your site are more likely to accept cookies. New visitors, comparison shoppers, and privacy-conscious users disappear from your data entirely. Every metric in your GA4 dashboard is inflated by survivorship bias.
See how we deliver AI-powered efficiency gains.
How Does Data Sampling Distort Your Numbers?
Lie 4: Sampling errors hide the details. GA4 applies data sampling when queries exceed approximately 500,000 events [4]. For a mid-market e-commerce store processing 1,000+ orders per day, this threshold is reached quickly on any report that spans more than a few days. Sampling means GA4 analyzes a subset of your data and extrapolates. The overall trends stay roughly accurate, but segment-level insights (mobile users from Berlin who viewed 3+ products) become unreliable.
I have seen this firsthand working on e-commerce frontends at easy.bi. A client was optimizing their mobile checkout based on GA4 data that showed a 68% cart abandonment rate on mobile. When we cross-referenced with server-side Matomo data, the actual rate was 74%. That 6-point gap meant the optimization priority was higher than the team realized, and the specific drop-off points were in different checkout steps than GA4 suggested.
Lie 5: Cross-device blindness breaks the journey. A shopper browses on their phone during lunch, adds items to a wishlist on their tablet in the evening, and completes the purchase on their laptop the next morning. Without cross-device tracking, analytics sees 3 separate users with 3 separate journeys. The mobile session looks like a bounce. The tablet session looks like abandoned interest. Only the desktop session gets conversion credit.
Cross-device users account for approximately 40% of all e-commerce transactions [5]. If your analytics cannot connect these sessions, you are systematically undervaluing mobile and overvaluing desktop.
Why Is GA4 Alone Not Enough for DACH E-Commerce?
GA4 is a good tool. It is not a complete solution, especially in the DACH market where privacy regulations and user behavior create unique challenges that GA4 was not designed to handle.
The consent problem is the most significant. With 40-60% of German users declining cookies, GA4 operates on partial data by default. Google's consent mode attempts to model the missing users through machine learning estimates, but these models are opaque and unverifiable. You are trusting a black box to fill in the gaps for the majority of your traffic.
The sampling problem compounds this. GA4's free tier applies sampling on large datasets, and even GA360 (the enterprise tier at $150,000+/year) has limits. For a DACH mid-market retailer processing millions of events monthly, sampling means that detailed segment analysis is approximate, not precise.
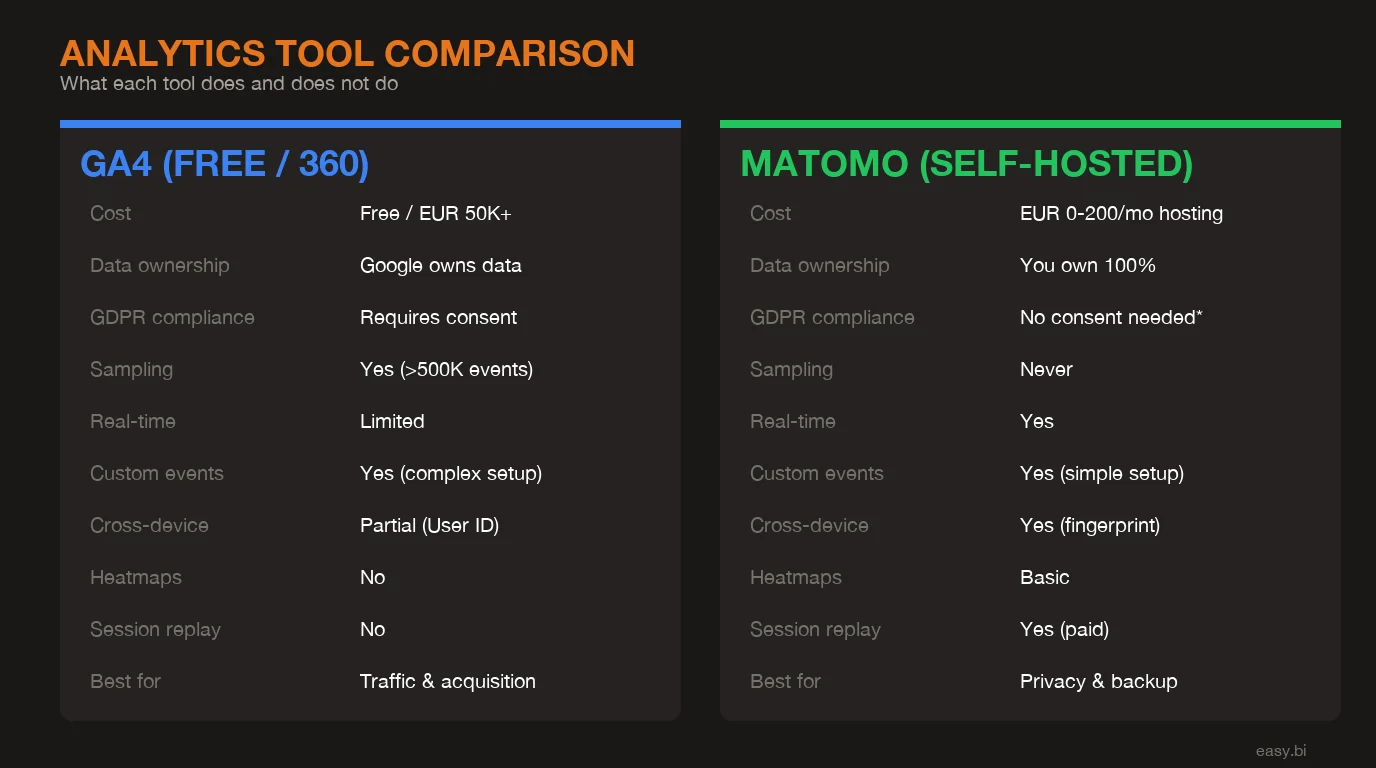
Then there is the data ownership question. GA4 data lives on Google's servers, processed under Google's terms. For European enterprises subject to GDPR and increasingly strict data sovereignty requirements, relying solely on a US-based analytics platform creates compliance risk that grows with every regulatory update.
| Capability | GA4 | Matomo | Hotjar | Datadog |
|---|---|---|---|---|
| Traffic and acquisition analysis | Strong | Strong | Limited | None |
| Privacy-first / server-side tracking | Weak (consent dependent) | Strong (no cookies needed) | Consent dependent | N/A |
| Behavioral UX data (heatmaps, recordings) | None | Basic (plugin) | Strong | None |
| Performance and error monitoring | None | None | None | Strong |
| Data ownership (EU hosting) | No (US servers) | Yes (self-hosted or EU cloud) | Partial (EU option) | Yes (EU regions) |
| Real-time alerting | Limited | Limited | None | Strong |
| Funnel analysis depth | Good | Good | Session-level | Error-level |
| Cost (mid-market scale) | Free / $150K+ (360) | Free (self-hosted) / paid cloud | $80-400/mo | Usage-based |
No single tool covers all four dimensions: acquisition, privacy, behavior, and performance. That is why a stack approach is the only honest answer.
What Does a Complete E-Commerce Analytics Stack Look Like?
The 4-tool stack eliminates the blind spots that single-tool setups create. Each tool has a specific role, and the combination produces a complete picture that no individual tool can deliver.
GA4: Traffic acquisition and channel performance. GA4 remains the best tool for understanding where your traffic comes from and how acquisition channels perform relative to each other. Its integration with Google Ads, Search Console, and BigQuery makes it the natural hub for paid and organic acquisition analysis. Use it for what it does well: channel attribution, campaign performance, and audience demographics. Do not rely on it as your single source of truth for on-site behavior [6].
Matomo: Privacy-first tracking and consent gap coverage. Matomo, configured for server-side tracking without cookies, captures the 40-60% of traffic that GA4 misses. Self-hosted Matomo keeps all data on your own servers, eliminating GDPR data transfer concerns entirely. Use it as your baseline traffic measurement (the true denominator) and cross-reference GA4 numbers against it. The delta between GA4 and Matomo shows you exactly how much consent bias is distorting your data.
Hotjar: Behavioral UX insights. Heatmaps, session recordings, and on-site surveys reveal why users behave the way they do. GA4 tells you that 62% of users drop off at the product detail page. Hotjar shows you that they scroll past the add-to-cart button without seeing it, or that they rage-click on an image expecting a zoom that does not exist. 64% of CRO professionals use heatmaps as their primary qualitative research tool [7]. Hotjar turns quantitative drop-offs into qualitative diagnoses.
Datadog: Performance and error monitoring. A 1-second delay in page load time reduces conversions by 7% [8]. Datadog monitors your site's technical performance in real time: page load speed, API response times, JavaScript errors, and server health. When your checkout page starts throwing 500 errors at 2 AM, Datadog alerts your team before the first customer complaint. Performance monitoring is not optional for e-commerce. It is the foundation that makes everything else work. For a detailed breakdown of which technical KPIs to monitor, see our guide on e-commerce monitoring KPIs.
What Should You Measure at Each Funnel Stage?
Analytics visibility means tracking the right metrics at the right stage. Most teams over-measure at the top of the funnel (traffic, impressions) and under-measure at the bottom (retention, lifetime value). Here is what matters at each stage.
Acquisition. Traffic by source, cost per acquisition by channel, landing page conversion rate, and new vs. returning visitor ratio. The goal: understand which channels bring visitors who actually buy, not just visitors who browse. Companies that align analytics with funnel stages see 2-3x better ROI on their marketing spend [9].
Activation. Product page engagement rate, add-to-cart rate, search usage rate, and filter usage rate. These micro-conversions reveal whether visitors are finding what they came for. A store with 50,000 monthly visitors and a 3% add-to-cart rate has an activation problem. A store with 10,000 visitors and a 12% add-to-cart rate has a traffic problem. The diagnosis determines the prescription.
Revenue. Checkout completion rate by step, payment method success rate, average order value, and revenue per visitor. Track each checkout step individually: shipping address, shipping method, payment, and confirmation. When you know that 23% of users abandon at the payment step specifically, you can investigate whether it is a UX issue, a trust issue, or a technical failure. For a deeper dive into conversion optimization techniques, see our guide on data-driven UX optimization.
Retention. Repeat purchase rate, time between purchases, customer lifetime value, and cohort retention curves. Most e-commerce analytics stops at the first purchase. But acquiring a new customer costs 5-7x more than retaining an existing one [10]. If your analytics cannot tell you which first-purchase experiences predict repeat buying, you are leaving compounding revenue on the table.
How Do You Set Up Event Tracking That Actually Works?
Default analytics setups track pageviews. That is not enough. E-commerce requires custom event tracking that captures the specific user actions that correlate with revenue. Here are the events every store should track.
Add-to-cart events. Track every add-to-cart action with product ID, product name, category, price, and the page it happened on. This lets you measure add-to-cart rate by product category, by traffic source, and by device type. A product with a high view count and low add-to-cart rate has a product page problem. A product with a high add-to-cart rate and low checkout completion has a checkout problem.
Checkout step events. Fire a separate event for each checkout step: cart review, shipping address, shipping method, payment method, and order confirmation. The step-by-step funnel reveals exactly where friction lives. 69.99% of online shopping carts are abandoned [11], but the reasons vary by step. Shipping cost surprises happen at the shipping step. Payment trust concerns happen at the payment step. You cannot fix what you cannot see.
Search query events. Track every internal search query, including zero-result searches. Search users convert at 1.8x the rate of non-search users, but zero-result searches are conversion killers. If 15% of your search queries return no results, that is 15% of your highest-intent traffic hitting a dead end. The fix is often simple: add product synonyms, correct common misspellings, and expand category mappings.
Error state events. Track form validation errors, API failures, out-of-stock encounters, and payment declines. Each error is a potential lost sale. When you can quantify that payment declines cost you EUR 12,000 per month, the business case for adding a backup payment provider writes itself.
From my experience building e-commerce frontends, the most overlooked tracking gap is error states. Teams obsess over happy-path analytics (how do successful conversions flow?) and ignore failure-path analytics (how do failed conversions break?). The failures are where the revenue is hiding.
3x faster development with our ebiCore AI framework
Identify your top AI opportunities, validate with a PoC, and ship to production.
Start with a Strategy CallHow Do You Build Dashboards That Tell the Truth?
Four analytics tools means four separate dashboards by default. That defeats the purpose. The goal is a unified view that combines data from all sources into dashboards organized around business questions, not tool boundaries.
The executive dashboard. Revenue per visitor (Matomo baseline), conversion rate by funnel stage (GA4 + Matomo cross-referenced), site health score (Datadog), and top UX issues (Hotjar). This dashboard answers one question: is the store performing better or worse than last week, and why?
The acquisition dashboard. Channel performance (GA4), true traffic volume (Matomo), landing page conversion rates (GA4 + Matomo), and consent rate trends (Matomo). This dashboard answers: which channels are actually driving revenue, and how much traffic are we missing?
The UX optimization dashboard. Funnel drop-off by step (GA4), heatmap summaries for top 10 pages (Hotjar), session recording highlights flagged by drop-off point (Hotjar), and page load times by template (Datadog). This dashboard answers: where are users struggling, and what is causing it? For practical methods to test and validate UX improvements, see our A/B testing best practices guide.
Tools like Looker Studio, Grafana, or custom-built dashboards can pull data from all four sources into unified views. The key is organizing by business question ("Why is checkout conversion dropping?") rather than by tool ("Here is the GA4 report, here is the Matomo report"). When a dashboard requires switching between 4 tabs to answer one question, it has failed its purpose.
How Do You Turn Analytics Data Into Decisions?
Data without a decision framework is just noise. The data-to-decision framework turns analytics findings into actions within a structured, repeatable process.
Step 1: Identify the anomaly. Dashboards should surface deviations from baseline, not just current values. A 2.4% conversion rate means nothing without context. A 2.4% conversion rate that was 3.1% two weeks ago means something. Configure alerts for metric drops that exceed your threshold (typically 10-15% deviation from rolling average).
Step 2: Diagnose the cause. Use the 4-tool stack in sequence. GA4 shows where the drop is happening (which page, which segment, which channel). Matomo confirms whether the drop is real or a consent rate fluctuation. Hotjar shows what changed in user behavior. Datadog reveals whether a technical issue is the root cause. Organizations that combine multiple analytics tools resolve conversion issues 60% faster than those relying on a single platform [12].
Step 3: Form a hypothesis. Based on the diagnosis, write a specific hypothesis: "Cart abandonment increased because the new shipping cost display creates sticker shock at step 3. Moving shipping cost visibility to the product page will reduce step 3 drop-off by 15%."
Step 4: Test and measure. Run an A/B test against the hypothesis. Measure the result against the specific metric identified in step 1. If the hypothesis is confirmed, ship the change. If not, the data from the failed test narrows the diagnosis for the next hypothesis.
Step 5: Document and compound. Every finding, whether confirmed or rejected, goes into a knowledge base. Over 12 months, this knowledge base becomes your most valuable analytics asset. It captures what works on your specific store, with your specific customers, in your specific market. No generic best practice article can replace that.
This framework is how easy.bi consistently delivers +35% conversion improvements across e-commerce projects. Not through a single insight, but through the compound effect of running this cycle every 14-day sprint, building on each finding, eliminating each blind spot one at a time.
What Does Proper Analytics Visibility Actually Deliver?
When you move from scattered single-tool analytics to a unified 4-tool stack with proper event tracking and decision frameworks, the operational shift is measurable.
Faster diagnosis. Conversion drops that used to take 2 weeks to investigate get resolved in 2 days because you can cross-reference 4 data sources immediately instead of guessing with one.
Accurate baselines. Matomo's server-side data gives you the true traffic denominator. Your conversion rates, AOV calculations, and channel ROI numbers reflect reality, not the consent-biased subset GA4 shows you.
UX visibility. Hotjar's behavioral data turns "conversion rate dropped" from a mystery into a diagnosis. When you can see that users are not scrolling to the CTA, or that they are confused by a new checkout step, the fix becomes obvious.
Technical confidence. Datadog ensures that analytics anomalies are user behavior issues, not technical failures masquerading as user behavior. A JavaScript error that prevents 5% of add-to-cart clicks from firing looks identical to a UX problem in GA4. Datadog separates the signal.
The compound effect of these improvements, applied systematically across acquisition, activation, revenue, and retention, is what produces the +35% conversion improvements we see across easy.bi's e-commerce engagements. Not one magic fix. A system that tells the truth and a team that acts on it.
If your analytics are scattered across disconnected tools and you suspect the data is not telling the full story, you are probably right. The first step is a proper analytics audit that maps your blind spots. Explore our e-commerce services or book an Expert Call to discuss what your data is missing.
References
- [1] Forrester, "The Data Digest: Half of All Data Goes Unused" - 53% of marketers sa Source
- [2] Google, "Consumer Journey Research" - The average e-commerce purchase involves 2. Source
- [3] Usercentrics, "Cookie Consent Statistics" - GDPR-compliant cookie consent banner Source
- [4] Google, "GA4 Data Thresholds and Sampling" - GA4 applies data sampling when quer Source
- [5] Criteo, "Cross-Device Commerce Report" - Cross-device users account for approxim Source
- [6] Google, "GA4 Documentation" - GA4 provides acquisition, engagement, and monetiza Source
- [7] Hotjar, "Conversion Rate Optimization" - 64% of CRO professionals use heatmaps a Source
- [8] Akamai, "State of Online Retail Performance" - A 1-second delay in page load tim Source
Explore Other Topics
Ready to unlock AI-driven efficiency?
30-minute call with an engineering lead. No sales pitch - just honest answers about your project.
98% engineer retention · 14-day delivery sprints · No lock-in contracts
Related Reading

E-Commerce Conversion Optimization: The 35% Improvement Framework
A systematic 6-lever framework that delivers +35% conversion rate and +22% AOV for DACH e-commerce. Page speed, checkout, product UX, search, cross-sell, and mobile optimization with measurable benchmarks.
Enno Bassen
The True Cost of Disconnected E-Commerce Systems (ERP, PIM, CRM)
Disconnected ERP, PIM, and CRM systems cost mid-market retailers 80+ hours of manual work per week and 23% in lost revenue. Learn the API-first integration architecture that eliminates data silos.
Enno Bassen
How REWE Runs Multi-Country E-Commerce on 14-Day Sprint Cycles
How enterprise retailers like REWE ship e-commerce features every 14 days. The sprint delivery model, team structure, and QA gates.
Enno Bassen