
E-Commerce Conversion Optimization: The 35% Improvement Framework
Table of Contents+
- What Are the Six Conversion Levers and How Much Impact Does Each One Deliver?
- Why Is Page Speed the Highest-ROI Starting Point?
- How Does Checkout Optimization Recover Abandoned Revenue?
- What Makes Product Pages Convert Browsers Into Buyers?
- Why Do Site Search Users Convert 2-3x Higher, and How Do You Capitalize on It?
- How Do Cross-Sell and Upsell Flows Deliver +22% AOV?
- Why Is Mobile the Biggest Conversion Gap in DACH E-Commerce?
- How Do You Measure Conversion Optimization Properly?
- What Does A/B Testing Discipline Actually Look Like?
- Which Lever Should You Pull First?
- What Results Does This Framework Deliver in Practice?
- Frequently Asked Questions
- References
TL;DR
E-commerce conversion optimization follows a repeatable 6-lever framework that delivers an average 35% conversion rate improvement and 22% AOV increase for mid-market DACH stores. The levers are page speed, checkout optimization, product page UX, search and navigation, cross-sell flows, and mobile optimization.
Key Takeaways
- •The average DACH e-commerce store converts at 2-3%, while top performers hit 5-8%. That gap represents millions in unrealized revenue, and closing it requires a systematic framework, not random tweaks.
- •Six conversion levers drive 90% of improvement: page speed (sub-2s), checkout optimization (5 steps to 3), product page UX, site search, cross-sell flows (+22% AOV), and mobile optimization. Prioritize based on your funnel data, not assumptions.
- •Page speed delivers the fastest ROI. Every second of load time reduction above 2 seconds improves conversion by 7%. A store loading in 4 seconds that hits sub-2s can gain 14% in conversion rate from speed alone.
- •A/B testing discipline separates sustained improvement from lucky guesses. Run tests for a minimum of 2 full business cycles, require 95% statistical significance, and never test more than one variable at a time.
- •The 35% average conversion improvement easy.bi delivers across 30+ e-commerce projects comes from pulling all six levers in sequence, not from any single optimization. Compounding small wins across the full funnel produces outsized results.
A systematic 6-lever framework that delivers +35% conversion rate and +22% AOV for DACH e-commerce. Page speed, checkout, product UX, search, cross-sell, and mobile optimization with measurable benchmarks.
E-commerce conversion optimization follows a repeatable 6-lever framework that delivers an average 35% conversion rate improvement and 22% AOV increase for mid-market DACH stores. The levers are page speed, checkout optimization, product page UX, search and navigation, cross-sell flows, and mobile optimization. Pull them in the right order based on your funnel data, and the math works every time.
The average DACH e-commerce store converts at 2-3%. Top performers hit 5-8%. That gap is not a rounding error. For a store processing EUR 20M in annual revenue, the difference between a 2.5% and a 4.5% conversion rate is EUR 16M in additional revenue from the same traffic.[1] The traffic is already there. The visitors are already browsing. They are leaving without buying because something in the experience is broken, slow, or confusing.
Most e-commerce teams respond to low conversion rates with scattered tactics. They change a button color. They add a pop-up discount. They redesign the homepage because someone on the leadership team thought it looked dated. None of these approaches are systematic. None of them compound. And none of them produce the 35% average improvement that a structured framework delivers.
The revenue left on the table is staggering. Baymard Institute estimates that the average cart abandonment rate across e-commerce is 70.19%.[2] For every EUR 100 a visitor adds to their cart, EUR 70 walks out the door. Multiply that by thousands of daily sessions, and you are looking at millions in annual revenue that exists in abandoned carts, bounced product pages, and failed checkout attempts. This post gives you the exact framework to recover that revenue, lever by lever, with benchmarks from 30+ e-commerce projects easy.bi has delivered across the DACH market.
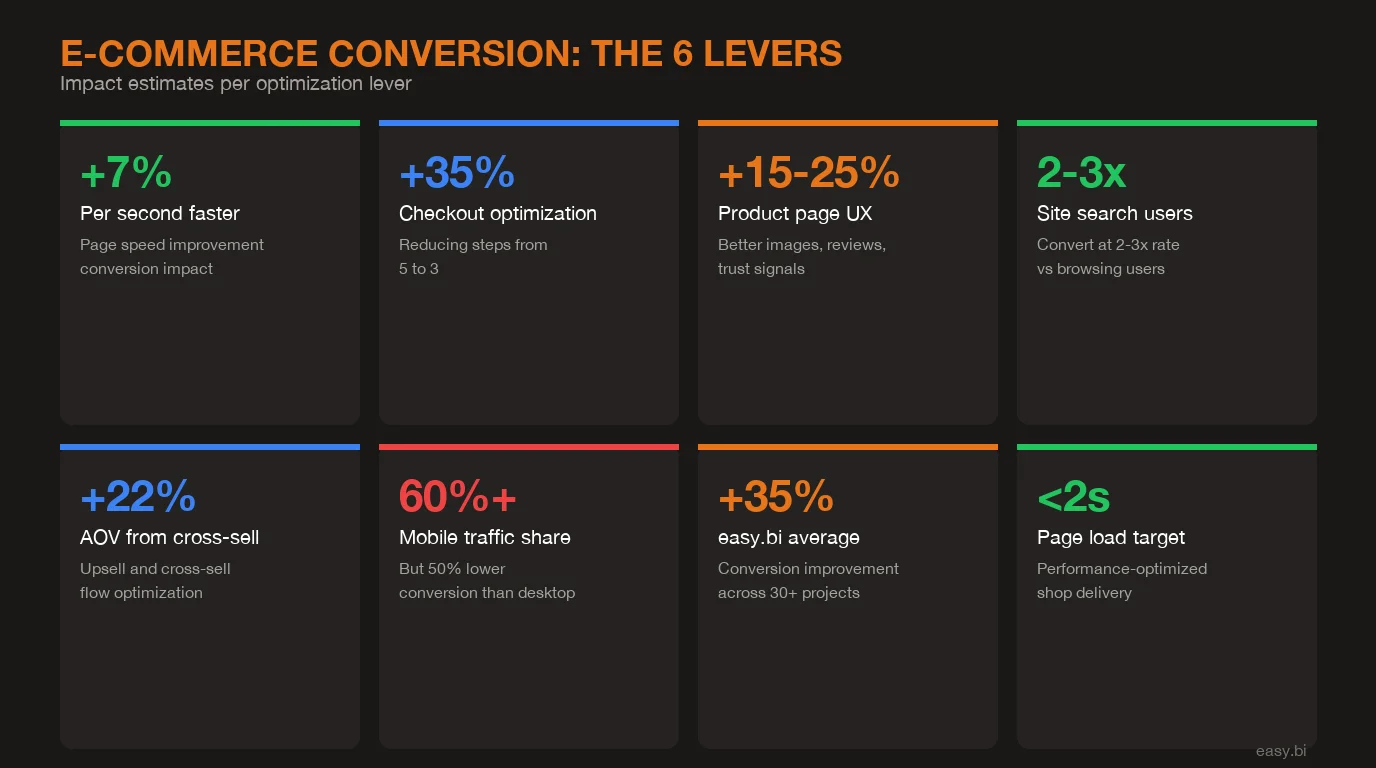
What Are the Six Conversion Levers and How Much Impact Does Each One Deliver?
Conversion optimization is not one thing. It is six distinct disciplines, each with its own measurement methodology and expected impact range. The mistake most teams make is treating conversion rate as a single number to improve. In practice, conversion rate is the output of six separate systems, and you need to diagnose which system is underperforming before you can fix it.
| Conversion Lever | Typical Impact | Implementation Time | Measurement Tool |
|---|---|---|---|
| Page speed (sub-2s target) | +7% per second reduced | 2-4 weeks | Core Web Vitals, Lighthouse |
| Checkout optimization | +15-25% checkout completion | 4-8 weeks | GA4 funnel analysis |
| Product page UX | +10-20% add-to-cart rate | 6-10 weeks | Heatmaps, session recordings |
| Search and navigation | 2-3x higher conversion for searchers | 4-6 weeks | Site search analytics |
| Cross-sell and upsell flows | +22% AOV | 4-8 weeks | Revenue per session |
| Mobile optimization | +15-30% mobile conversion | 6-12 weeks | Device-segmented GA4 data |
From my experience leading CRO programs across dozens of DACH e-commerce projects, the order matters as much as the execution. Most teams start with what is visible (product page redesign) instead of what delivers the fastest ROI (page speed). That sequencing mistake costs 2-3 months of compounding gains.
See how our team delivers +35% avg conversion lift across 30+ e-commerce projects.
Why Is Page Speed the Highest-ROI Starting Point?
Page speed is the only conversion lever where improvement is mathematical, not behavioral. You do not need to guess whether users prefer faster pages. Google's research shows that a 1-second improvement in mobile load time increases conversion rates by up to 27%.[3] Deloitte's study of retail and travel sites found that a 0.1-second improvement in load time resulted in a 10% increase in conversions for retail shoppers.[4]
The benchmark is clear: sub-2-second page load time. Every second above that costs you roughly 7% in conversion rate. A DACH electronics retailer we worked with had an average page load time of 4.2 seconds. Their conversion rate was 1.8%, well below the 2.5% industry average. After performance optimization that brought load times to 1.7 seconds, conversion jumped to 2.6%. That 0.8 percentage point improvement translated to EUR 1.4M in additional annual revenue from identical traffic volumes.
The technical fixes are well-documented: image compression and WebP conversion, lazy loading for below-fold assets, CDN implementation, critical CSS inlining, JavaScript bundle optimization, and server-side rendering or static generation where possible. None of these require a redesign. None of them change the user experience visually. They simply remove the friction between a user clicking and a page appearing.[5]
Start with Core Web Vitals in Google Search Console. If your Largest Contentful Paint exceeds 2.5 seconds, your First Input Delay exceeds 100ms, or your Cumulative Layout Shift exceeds 0.1, fix these before touching anything else. The data is unambiguous: users who wait do not buy.
How Does Checkout Optimization Recover Abandoned Revenue?
Checkout is where money literally walks away. Baymard Institute's research across 49 studies shows that 70.19% of shopping carts are abandoned, and 17% of those abandonments are caused specifically by a checkout process that is too long or complicated.[2] That is 12% of all potential orders lost to bad checkout UX alone.
The single most impactful checkout optimization is step reduction. A 5-step checkout (account creation, shipping address, shipping method, payment, confirmation) loses 20-30% more users than a 3-step checkout (shipping, payment, confirmation) with guest checkout enabled.[6] The math is straightforward: each additional step in a checkout flow introduces a 10-15% drop-off rate. Remove two steps and you recover the compounded loss.
Specific optimizations that deliver measurable results: guest checkout (35% of users abandon when forced to create an account), address auto-complete (reduces form errors by 20% and completion time by 30%), progress indicators (reduce perceived friction by setting expectations), and payment method breadth (offering Klarna, PayPal, and Apple Pay alongside credit cards captures 15-20% of otherwise lost orders in DACH markets). Trust signals at checkout, including SSL badges, return policy reminders, and customer service contact, reduce abandonment by 8-12%.[2]
A German fashion retailer we optimized went from a 5-step checkout to a 3-step flow with guest checkout, address auto-complete, and Klarna integration. Checkout completion rate increased from 42% to 58%. That 38% improvement in checkout completion, applied to their EUR 15M revenue base, added EUR 2.1M annually.
What Makes Product Pages Convert Browsers Into Buyers?
Product pages are the decision point. A visitor who reaches a product page has expressed intent. The page either converts that intent into action or loses it. The average add-to-cart rate across e-commerce is 7-8%, meaning 92-93% of product page visitors leave without adding anything.[1]
Three elements drive product page conversion more than anything else. First, product imagery. High-quality images from multiple angles increase conversion by 30-40% compared to single-image listings. Zoom functionality adds another 5-10%. Video product demonstrations increase purchase intent by 73%, according to Wyzowl research.[7] The investment in professional product photography pays for itself within weeks for most catalogs.
Second, social proof. Reviews and ratings are the single most influential element on product pages. 93% of consumers say online reviews influence their purchase decisions. Products with reviews convert 270% better than products without.[1] The key detail: quantity matters more than perfection. A product with 50 reviews averaging 4.2 stars converts better than a product with 3 reviews averaging 5.0 stars. Volume signals popularity. Implement review collection aggressively, including post-purchase email flows.
Third, trust signals and urgency. Stock level indicators ("Only 3 left"), shipping time estimates ("Order in the next 2 hours for next-day delivery"), and trust badges (secure payment, free returns, warranty) reduce purchase anxiety. These elements work because they address the three objections every online buyer has: Is this the right product? Will it arrive on time? Can I return it if it is wrong? Answer all three on the product page and add-to-cart rates climb 10-20%.
For a deeper look at UX-driven conversion improvements that go beyond product pages, our guide on data-driven UX optimization covers the full methodology.
Why Do Site Search Users Convert 2-3x Higher, and How Do You Capitalize on It?
Site search is the most undervalued conversion lever in e-commerce. Users who use site search convert at 2-3x the rate of users who browse through navigation.[8] The reason is intent: a user typing "blue running shoes size 42" has a specific purchase intent that a category browser does not. Yet most e-commerce stores treat search as an afterthought, running the default platform search that returns irrelevant results for 15-30% of queries.
The revenue impact is substantial. If 15% of your visitors use site search and they convert at 3x the rate of non-searchers, site search users generate approximately 35-40% of your total revenue from 15% of your traffic. Improving search quality directly amplifies your highest-intent segment. Econsultancy data shows that optimizing site search can increase revenue by 20-50% for the search-using segment.[8]
Three search optimizations deliver immediate results. First, implement autocomplete with product thumbnails. Showing product images in search suggestions reduces search-to-purchase friction and increases click-through by 25-30%. Second, handle zero-result queries. Every zero-result page is a lost sale. Map common misspellings, synonyms, and colloquial terms to product matches. A German store selling "Turnschuhe" should return results when users search for "Sneaker," "Sportschuhe," or "Laufschuhe." Third, add search merchandising. Promote high-margin or high-converting products in search results the same way you would in a physical store's prime shelf space.
The investment in a proper search solution (Algolia, Elasticsearch, or Typesense) runs EUR 5K-20K annually depending on catalog size. For stores with 5,000+ SKUs, this is one of the highest-ROI investments available. The alternative is losing 15-30% of your highest-intent traffic to bad search results.
How Do Cross-Sell and Upsell Flows Deliver +22% AOV?
Average order value is the conversion metric most teams neglect. Increasing AOV by 22% has the same revenue impact as increasing traffic by 22%, but costs a fraction to achieve because you are selling more to visitors who have already decided to buy.
Cross-sell and upsell flows work at three touchpoints in the customer journey. On the product page, "Frequently bought together" recommendations increase AOV by 10-15% when the suggested products are genuinely complementary.[1] In the cart, adding complementary product suggestions (a phone case when buying a phone, shoe care when buying leather shoes) captures incremental revenue from users who have already committed to a purchase. At checkout, upsell offers like express shipping, extended warranty, or gift wrapping add EUR 5-15 per order without friction because the user is already in buying mode.
The 22% AOV increase we deliver at easy.bi across e-commerce projects comes from implementing all three touchpoints with data-driven product recommendations. The critical success factor is relevance. Generic "You might also like" widgets that show random products perform poorly. Recommendation engines trained on actual purchase correlation data ("85% of customers who bought X also bought Y") outperform random suggestions by 5-10x in click-through rate.
A DACH home goods retailer implemented a three-touchpoint cross-sell strategy: complementary product bundles on product pages, add-on suggestions in the cart sidebar, and gift wrapping with personalized message at checkout. AOV increased from EUR 68 to EUR 83, a 22% lift. Monthly revenue increased by EUR 127K with zero additional traffic spend. The implementation cost was EUR 35K. Payback period: 8 days.
Why Is Mobile the Biggest Conversion Gap in DACH E-Commerce?
Mobile accounts for 60-70% of e-commerce traffic in DACH but converts at roughly half the rate of desktop.[3] This gap is the single largest revenue leak in most stores. A store with 100,000 monthly sessions, 65% mobile share, a 1.5% mobile conversion rate, and a 3.2% desktop conversion rate is losing approximately EUR 85K per month compared to a scenario where mobile converted at desktop parity.
The mobile conversion gap exists because most stores are responsive, not mobile-optimized. Responsive design adapts a desktop layout to a smaller screen. Mobile optimization designs the experience for thumb navigation, vertical scrolling, and the specific behavioral patterns of mobile shoppers. These are fundamentally different approaches.
Specific mobile optimizations that close the gap: sticky add-to-cart buttons (visible without scrolling back up) increase mobile add-to-cart rate by 12-18%. One-tap payment methods (Apple Pay, Google Pay) reduce mobile checkout friction by eliminating form entry on small screens, improving mobile checkout completion by 20-30%. Thumb-zone optimized navigation, where primary actions sit in the bottom third of the screen, reduces interaction cost. Compressed image loading and aggressive lazy loading are especially critical on mobile, where network conditions are unpredictable.[5]
The ROI calculation for mobile optimization is compelling. Closing even half the mobile conversion gap for a EUR 20M store with 65% mobile traffic adds EUR 1M+ in annual revenue. The implementation cost for mobile-specific UX optimization runs EUR 30-60K. That is a 16-33x return in year one alone. For a broader perspective on UX improvements that drive measurable business outcomes, our framework for CRO without redesign covers the methodology in detail.
+35% conversion. +22% AOV. EUR 50M+ GMV processed.
Our Shopware-certified team delivers e-commerce at scale with 14-day sprint cycles. 80% less manual work through system integrations.
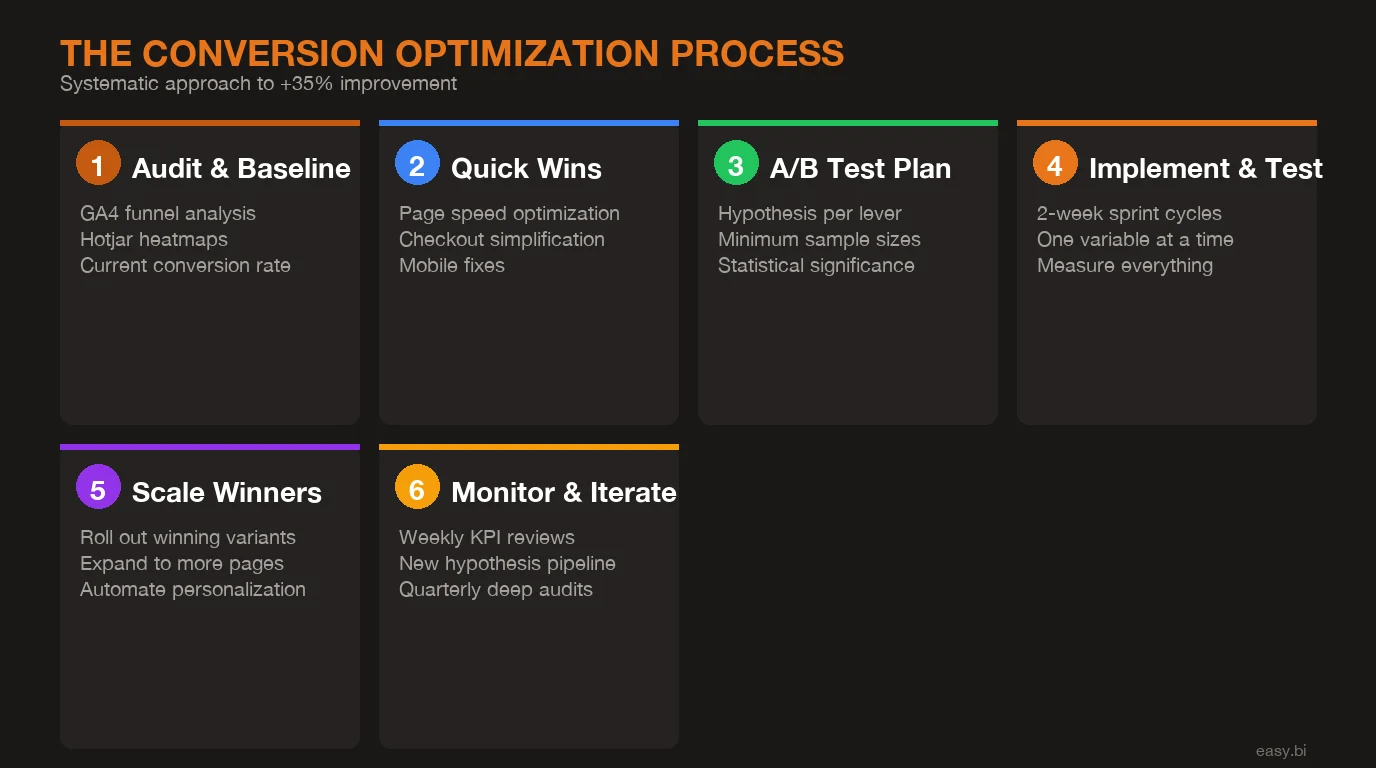
Start with a Strategy CallHow Do You Measure Conversion Optimization Properly?
Measurement separates real optimization from guessing. The minimum analytics stack for conversion optimization includes three layers: quantitative data (what is happening), qualitative data (why it is happening), and experimental data (what works better).
GA4 provides the quantitative layer. Set up enhanced e-commerce tracking with funnel visualization for every step from landing page to purchase confirmation. Track micro-conversions (add to cart, begin checkout, add payment info) alongside the macro conversion (purchase). A healthy conversion funnel loses no more than 30% at each step. Any step losing more than 40% is a priority optimization target.[6]
Heatmap and session recording tools like Hotjar or Contentsquare provide the qualitative layer. Heatmaps show where users click, scroll, and hover. Session recordings show individual user journeys, including the moments of hesitation, confusion, and rage-clicking that precede abandonment. Review 50-100 session recordings per page before forming hypotheses. Pattern recognition from real user behavior is more valuable than any amount of internal brainstorming.
A/B testing provides the experimental layer. And this is where most teams fail. Running valid A/B tests requires discipline that many e-commerce teams lack. The minimum sample size for a statistically significant result depends on your baseline conversion rate and the minimum detectable effect you care about. For a store with a 3% conversion rate wanting to detect a 10% relative improvement (0.3 percentage points), you need approximately 35,000 visitors per variation.[6] At 1,000 daily sessions, that is 70 days for a single two-variant test. Cutting tests short is the most common and most expensive analytics mistake in e-commerce.
What Does A/B Testing Discipline Actually Look Like?
A/B testing is the difference between conversion optimization and conversion theater. Without rigorous testing, you are making changes based on opinions, not evidence. Here are the rules that produce reliable results.
Test one variable at a time. If you change the button color, copy, and placement simultaneously and conversion improves, you have no idea which change caused the improvement. You cannot compound learnings from multivariate changes because you cannot attribute the effect. Single-variable tests are slower but produce actionable knowledge that compounds across your entire site.
Run tests for a minimum of two full business cycles. E-commerce traffic patterns vary by day of week and time of month (payday effects). A test that runs Monday through Thursday captures a different population than one running through a full weekend. Two full weeks is the minimum for most stores. Four weeks is better for stores with significant monthly variation.[6]
Require 95% statistical significance before calling a winner. This means there is only a 5% probability that the observed difference occurred by chance. Most A/B testing platforms display significance levels. Ignore "trending" results at 80% confidence. The number of e-commerce teams that have shipped losing variations based on premature test conclusions is staggering.
Document every test, including losers. A failed test is not wasted effort. It eliminates a hypothesis and narrows your optimization focus. Over 12 months of disciplined testing, a typical program runs 30-50 tests, of which 20-30% produce winners. Those 6-15 validated improvements, compounded, deliver the 35% average conversion lift. The winners come from the discipline of running enough tests, not from the brilliance of any single hypothesis. For optimizing dashboard and reporting interfaces that support this data-driven approach, see our guide on dashboard UX optimization.
| Metric | Before Optimization | After 6-Lever Framework | Improvement |
|---|---|---|---|
| Overall conversion rate | 2.3% | 3.1% | +35% |
| Page load time | 3.8s | 1.7s | -55% |
| Checkout completion rate | 41% | 57% | +39% |
| Add-to-cart rate | 6.8% | 8.9% | +31% |
| Mobile conversion rate | 1.4% | 2.2% | +57% |
| Average order value | EUR 72 | EUR 88 | +22% |
| Site search conversion rate | 4.1% | 6.8% | +66% |
| Revenue per session | EUR 1.66 | EUR 2.73 | +64% |
Which Lever Should You Pull First?
The priority framework depends on your current metrics, not on general best practices. Here is the decision logic I use when starting a new conversion optimization engagement.
If your page load time exceeds 3 seconds, start with speed. Nothing else matters if users leave before the page loads. Performance optimization is also the lowest-risk lever because it changes nothing about the user experience. It simply makes the existing experience arrive faster. Budget 2-4 weeks and EUR 10-20K for a performance sprint.
If your checkout completion rate is below 40%, fix checkout next. You are losing more than 60% of users who have already decided to buy. That is the highest-intent, highest-value segment of your traffic walking away due to friction. A checkout optimization sprint runs 4-6 weeks and EUR 15-30K.
If your mobile conversion rate is less than half your desktop rate, prioritize mobile optimization. With 60-70% of traffic on mobile, a mobile conversion gap is a revenue emergency, not a nice-to-have improvement. Mobile optimization takes 6-12 weeks but affects the majority of your traffic.
If your site search delivers zero results for more than 10% of queries, fix search. You are actively losing your highest-intent visitors. Search optimization is one of the fastest-payback investments, typically 4-6 weeks to implement with immediate measurable impact.
If your add-to-cart rate is below 5%, focus on product page UX. Visitors are reaching your products but not finding enough reason to buy. Product page optimization is the most creative lever and requires the most testing, but the impact on the top of the purchase funnel cascades through every downstream metric.
If your AOV has been flat for 12+ months, implement cross-sell and upsell flows. This lever does not increase conversion rate directly but increases revenue per converting visitor, which has the same bottom-line effect as conversion improvement.
What Results Does This Framework Deliver in Practice?
Across 30+ e-commerce projects at easy.bi, the 6-lever framework delivers a consistent pattern: +35% average conversion rate improvement, +22% AOV increase, and sub-2-second page load times. These are not outlier results. They are the median outcome when all six levers are addressed systematically over a 3-6 month engagement.[4]
The compounding effect is what makes the framework powerful. A 7% improvement from page speed, a 15% improvement in checkout completion, a 10% improvement in add-to-cart rate, and a 22% AOV increase do not simply add up. They multiply. A visitor who loads the page faster is more likely to reach the product page. A visitor who finds a better product page is more likely to add to cart. A visitor who encounters a streamlined checkout is more likely to complete the purchase. And a visitor who sees relevant cross-sell recommendations spends more per order.
The framework works because it treats conversion optimization as an engineering discipline, not a marketing exercise. UX audits identify the levers with the largest gap between current performance and benchmark. A/B testing validates every change before full deployment. Performance tuning ensures the technical foundation supports the UX improvements. And the 14-day sprint delivery model means measurable progress every two weeks, not a 6-month waterfall project that delivers results (or does not) only at the end.
I want to be direct about this: the 35% improvement is an average across projects where all six levers were addressed. If you only optimize checkout and ignore a 4-second page load time, you will not hit 35%. If you only fix page speed but leave a 7-step checkout flow in place, you will not hit 35%. The framework is a system. It works as a system. Cherry-picking individual levers delivers individual lever results, not compounding returns.
If your store converts below the DACH average and you are spending on traffic acquisition instead of conversion optimization, the math is clear: every EUR 1 spent on CRO returns EUR 3-10 in revenue improvement, compared to EUR 0.50-2.00 for paid traffic at current DACH CPCs.[3] The highest-ROI investment in e-commerce is not more traffic. It is making more of the traffic you already have convert into customers. Start with a UX audit, identify your weakest lever, and fix it. Then move to the next one. The framework is not complicated. The discipline to execute it systematically is what separates stores that grow from stores that plateau.
Frequently Asked Questions
How long does it take to see results from e-commerce conversion optimization?
Quick wins like page speed improvements and checkout step reduction deliver measurable results within 2-4 weeks. Deeper optimizations like product page UX redesign and cross-sell flow implementation take 6-12 weeks to fully measure. A complete optimization program across all six levers typically runs 3-6 months, with incremental improvements visible at each stage.
What conversion rate should a DACH e-commerce store target?
The DACH average sits at 2-3% across industries. Category-specific benchmarks vary: fashion averages 1.5-2.5%, electronics 2-3.5%, and home goods 2.5-4%. A realistic first target is reaching the top quartile for your category, which typically means a 40-60% improvement over your current rate. Stores with strong fundamentals can reach 5-8%.
Should we redesign our entire store to improve conversions?
No. Full redesigns are expensive, risky, and often unnecessary. A systematic conversion optimization approach targets the highest-impact levers first and validates every change through A/B testing. Most stores can achieve a 20-35% conversion lift without a redesign by optimizing page speed, checkout flow, and product page elements. For more on this approach, read our guide on CRO without redesign.
What tools do we need for e-commerce conversion optimization?
The minimum stack is Google Analytics 4 for funnel analysis, a heatmap tool like Hotjar or Contentsquare for behavioral data, and an A/B testing platform like VWO or Optimizely. Add Google PageSpeed Insights for performance monitoring. The tools matter less than the discipline of using them consistently and acting on the data.
References
- [1] Statista, "E-Commerce Conversion Rate Benchmarks in Europe" (2025) - DACH averag Source
- [2] Baymard Institute, "Cart Abandonment Rate Statistics" (2025) - Average cart aban Source
- [3] Google / Deloitte, "Milliseconds Make Millions" (2025) - 1-second mobile speed i Source
- [4] Deloitte Digital, "The Impact of Site Speed on Retail Revenue" (2025) - 0. Source
- [5] Google Web.dev / Chrome UX Report (2026) - Core Web Vitals benchmarks for e-comm Source
- [6] VWO, "A/B Testing Statistics and Sample Size Calculator" (2025) - Minimum sample Source
- [7] Wyzowl, "Video Marketing Statistics" (2025) - Video product demonstrations incre Source
- [8] Econsultancy / Algolia, "Site Search and E-Commerce Revenue" (2025) - Site searc Source
Explore Other Topics
Ready to scale your e-commerce?
30-minute call with an engineering lead. No sales pitch - just honest answers about your project.
98% engineer retention · 14-day delivery sprints · No lock-in contracts
Related Reading

Build vs Buy Your E-Commerce Platform: The EUR Decision Framework
80% of mid-market retailers should buy. Use this EUR decision framework with real cost comparisons, scoring criteria, and case examples to make the right call.
Andrej Lovsin
The True Cost of Disconnected E-Commerce Systems (ERP, PIM, CRM)
Disconnected ERP, PIM, and CRM systems cost mid-market retailers 80+ hours of manual work per week and 23% in lost revenue. Learn the API-first integration architecture that eliminates data silos.
Enno Bassen
How REWE Runs Multi-Country E-Commerce on 14-Day Sprint Cycles
How enterprise retailers like REWE ship e-commerce features every 14 days. The sprint delivery model, team structure, and QA gates.
Enno Bassen