
The True Cost of Legacy Systems: What Your CFO Isn't Tracking
Table of Contents+
- The 60-80% Budget Trap
- Visible vs. Hidden Costs: Where the Money Actually Goes
- Why Does Legacy Tech Drive Away Your Best Engineers?
- How Do Integration Workarounds Compound the Problem?
- The Security Debt Nobody Wants to Talk About
- Breaking the Cycle Without Breaking the Business
- What Does a Realistic Modernization Timeline Look Like?
- How Do You Build the Business Case for Modernization?
- Stop Maintaining. Start Building.
- References
TL;DR
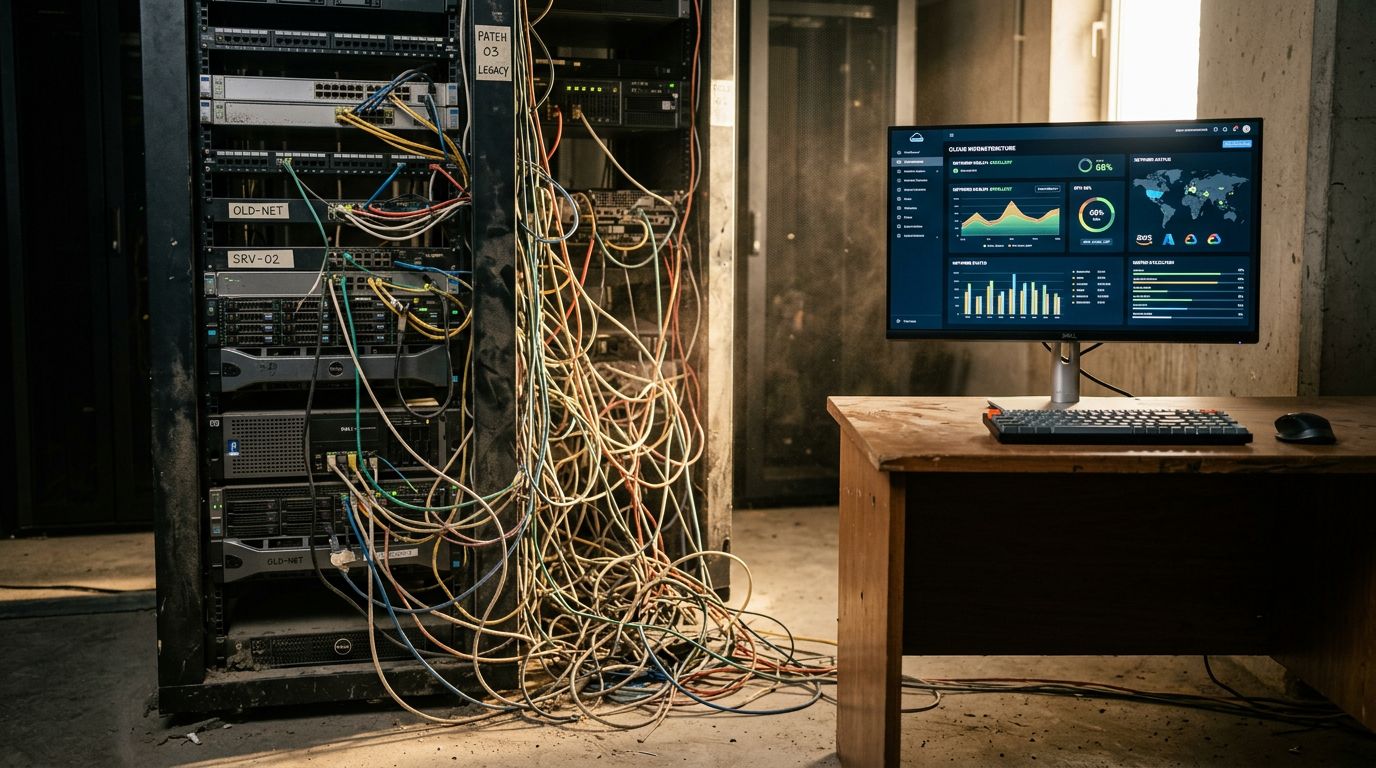
Every enterprise has them. Systems built 8-15 years ago that still run critical business processes. They work - mostly. But the cost of keeping them running is silently draining your capacity to grow.
Key Takeaways
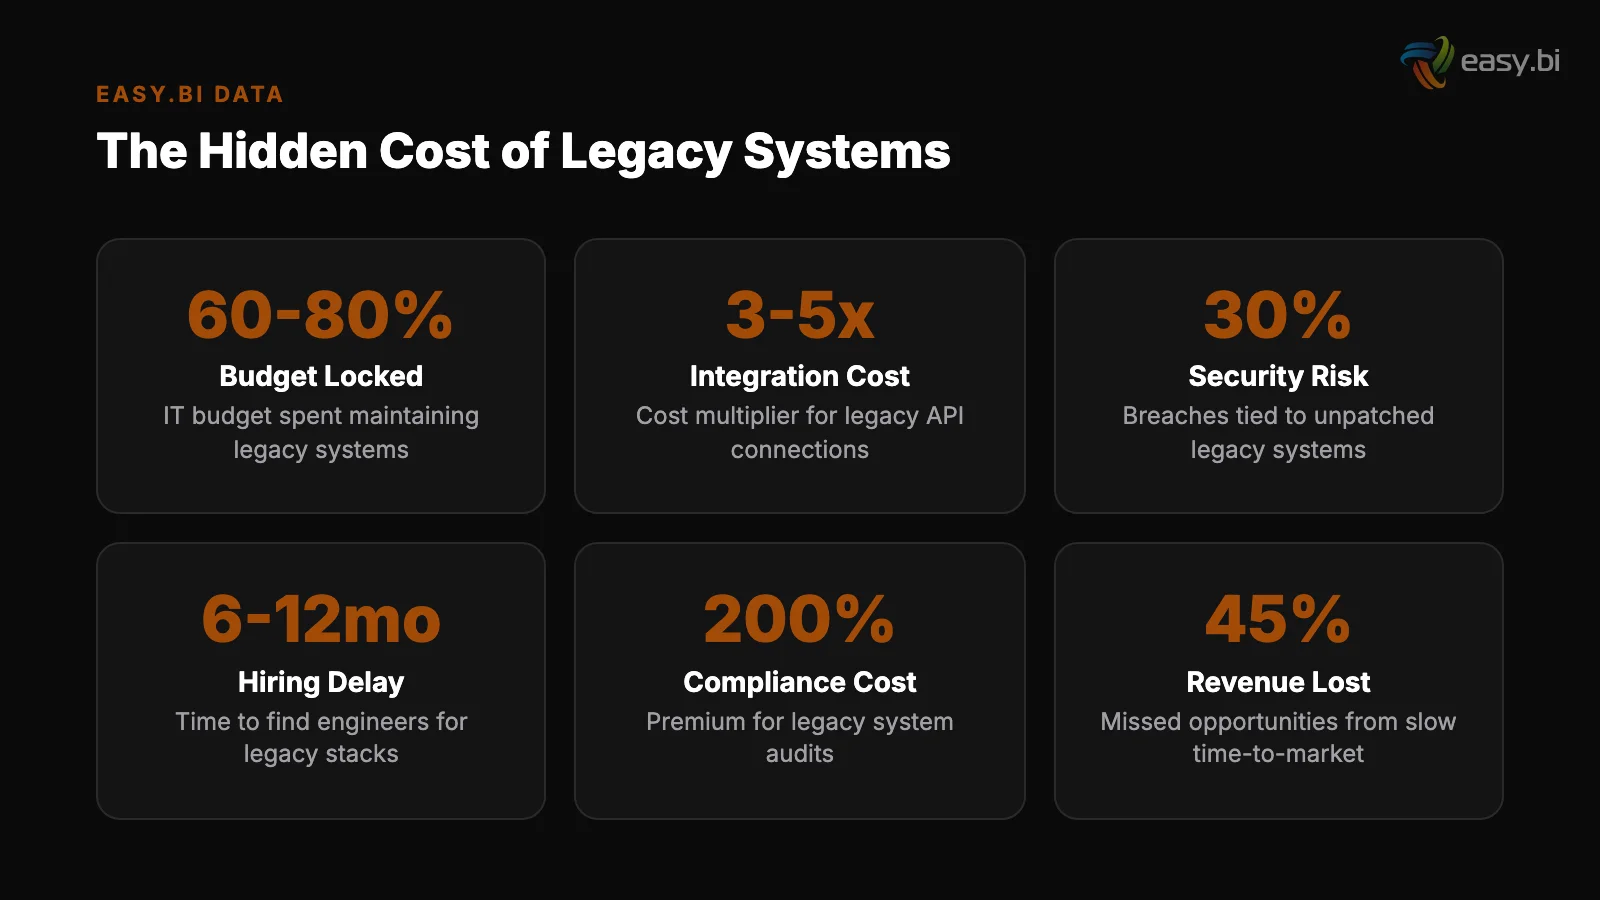
- •Legacy system maintenance consumes 60-80% of IT budgets at mid-market enterprises, leaving almost nothing for growth initiatives.
- •The hidden costs - developer attrition, integration workarounds, and security patching - typically exceed the visible maintenance line item by 3-5x.
- •Senior engineers leave companies with legacy stacks at 2.5x the rate of companies using current technologies, costing 6-9 months of salary per departure.
- •Incremental modernization with 14-day sprint delivery reduces migration risk while freeing budget for new capabilities within the first quarter.
- •WeberHaus achieved 100% process digitization by replacing legacy order processing with Angular and Ionic - cutting maintenance burden by 70% in year one.
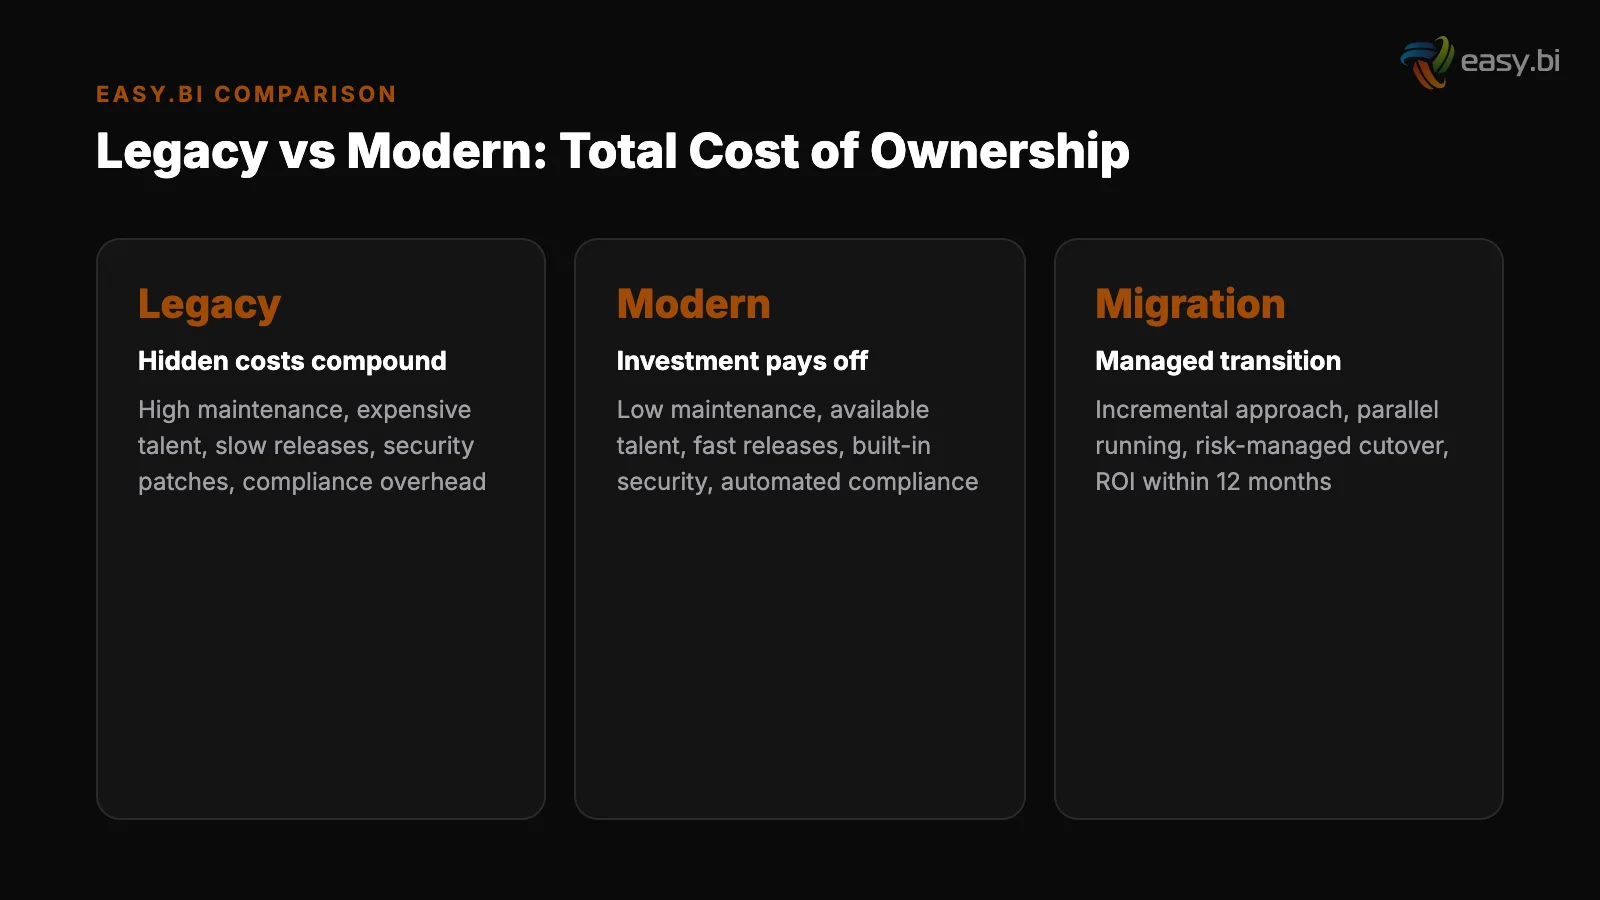
Legacy systems cost 3-5x more than their replacement when you factor in lost productivity, talent attrition, and missed market opportunities. Here's the full picture.
Every enterprise has them. Systems built 8-15 years ago that still run critical business processes. They work - mostly. But the cost of keeping them running is silently draining your capacity to grow.
The visible cost of legacy systems is the maintenance budget line item.
The real cost is everything your finance team does not track: the senior developers who quit because they refuse to maintain COBOL or outdated PHP frameworks, the 6-month timeline for changes that should take 2 weeks, and the market opportunities you cannot pursue because your systems cannot support them.
After 100+ projects at easy.bi - including legacy modernization for companies like WeberHaus, Lekkerland, and Basalt-Actien-Gesellschaft - we have mapped exactly where the money disappears. The total is consistently 3-5x what shows up on the balance sheet.
The 60-80% Budget Trap
Gartner estimates that mid-market enterprises spend 60-80% of their IT budgets on maintaining existing systems.[1] That leaves 20-40% for everything else - new features, new products, new markets, competitive responses.
This ratio compounds over time. As legacy systems age, maintenance costs increase while the systems deliver less value.
The Compounding Budget Squeeze
Every year the budget squeeze gets tighter. Teams spend more time keeping the lights on and less time building anything new.[2]
Here is what that looks like in practice. A mid-market manufacturer with a EUR 2M annual IT budget spends EUR 1.2-1.6M on maintaining legacy ERP integrations, patching security vulnerabilities in end-of-life frameworks, and paying for vendor support contracts on software that stopped receiving feature updates 3 years ago.
What It Looks Like in Practice
That leaves EUR 400-800K for all new development. One ambitious project consumes the entire innovation budget for the year.
The CFO sees the EUR 1.6M maintenance line and calls it "IT infrastructure costs." They do not see it as a tax on growth. But that is exactly what it is.
Year over year, this budget trap tightens. The legacy systems demand more attention as they age. Dependencies on deprecated libraries multiply.
The vendor increases support contract prices because fewer clients remain on the old version. What started as 60% of the IT budget in year one becomes 75% by year three and 85% by year five.
At that point, the IT department exists primarily to maintain the past, not to build the future.
See how enterprises modernize with one team.
Visible vs. Hidden Costs: Where the Money Actually Goes
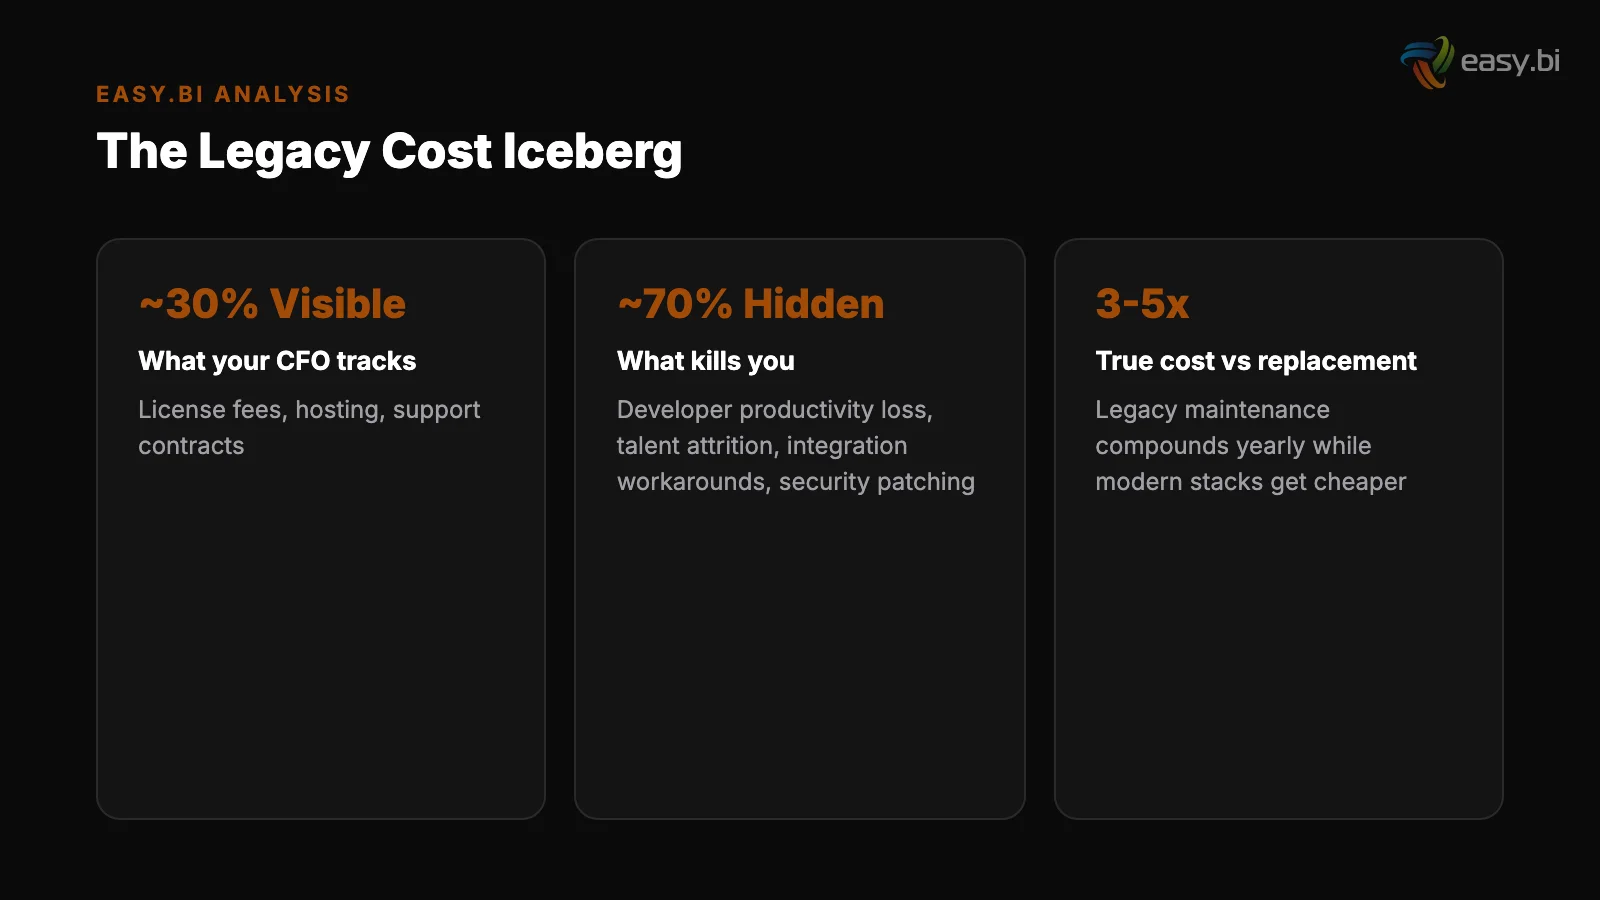
The maintenance budget is the visible tip. Below the surface, legacy systems generate costs that never appear in the IT line item.
| Cost Category | Visible (Tracked) | Hidden (Untracked) |
|---|---|---|
| Maintenance | Vendor support contracts, hosting fees | Internal team hours spent on workarounds and patches |
| Development speed | Sprint velocity metrics | 3-5x longer feature delivery due to legacy constraints |
| Talent | Recruiting budget | 6-9 months salary per senior engineer who leaves because of the tech stack |
| Security | Annual security audit cost | Incident response costs when unpatched systems get breached |
| Integration | Middleware license fees | Custom adapters and manual data entry bridging incompatible systems |
| Opportunity | Not tracked at all | Revenue from features, products, and markets you cannot pursue |
The hidden column typically totals 3-5x the visible column. A company spending EUR 500K per year on visible legacy maintenance is actually spending EUR 1.5-2.5M when you account for lost productivity, talent replacement, and unrealized revenue.
Why Does Legacy Tech Drive Away Your Best Engineers?
Your best engineers do not want to maintain legacy systems. They want to build. When your team spends 80% of their time on maintenance, your top performers start looking elsewhere.
The numbers are stark. Replacing a senior engineer costs 6-9 months of salary in recruiting, onboarding, and lost productivity. In the DACH market, where the senior engineering talent gap sits at 45%[3], replacement can take even longer. Some positions stay open for 6+ months.
This creates a vicious cycle. Legacy systems drive away talent. Fewer capable engineers means slower modernization. Slower modernization means the legacy stack stays longer. The remaining team burns out. More people leave.
We see this pattern repeat across industries. A mid-market retailer running a 12-year-old PHP monolith lost 4 senior engineers in 18 months. Each departure cost roughly EUR 80-120K in direct replacement costs. The indirect cost - delayed product launches, lost institutional knowledge, remaining team morale - was multiples higher.
The talent drain has a second-order effect that most leaders miss. As senior engineers leave, the remaining team skews junior. Junior engineers working on legacy systems without senior guidance make more mistakes, create more technical debt, and are less likely to push for modernization. The system degrades faster.
The cycle accelerates.
The most expensive legacy system cost is not the maintenance contract. It is the senior engineer who updates their LinkedIn profile because they are tired of debugging a framework that stopped receiving updates in 2019.
How Do Integration Workarounds Compound the Problem?
Legacy systems rarely exist in isolation. They connect to ERPs, CRMs, payment systems, warehouse management tools, and analytics platforms. When the legacy system cannot support a modern API, teams build workarounds.
These workarounds start small. A CSV export here. A manual data entry step there. A custom middleware adapter that one developer built 3 years ago and nobody else understands.
Over time, the workaround layer becomes its own legacy system. It is undocumented, fragile, and dependent on specific people who know where the duct tape is. When those people leave - and they will - the workaround layer becomes a critical business risk.
Lekkerland faced exactly this challenge with their SAP landscape. Years of custom integrations had created a web of dependencies that no single person fully understood. The S/4HANA migration was not just a platform upgrade.
It was an archaeology project - excavating layers of workarounds to understand what the system actually did before rebuilding it on a modern foundation.
The Security Debt Nobody Wants to Talk About
Legacy systems running end-of-life software accumulate security debt with every passing month. The vendor stops releasing patches. Known vulnerabilities go unaddressed. Your security team either accepts the risk or builds compensating controls that add more complexity and cost.
The average cost of a data breach for a mid-market company[5] in the DACH region exceeds EUR 4M. For companies running unpatched legacy systems, the probability of a breach increases 3x compared to organizations on supported platforms.
This is not a theoretical risk. Ransomware attacks specifically target legacy systems because attackers know the vulnerabilities are documented and unpatched. The cost of one incident can exceed a decade of modernization investment.

Breaking the Cycle Without Breaking the Business
Full rip-and-replace modernization is how legacy migration projects fail. You spend 18 months rebuilding everything, launch it all at once, and discover that half the business rules were undocumented and the new system does not handle them.
The WeberHaus Modernization
The proven approach is incremental. Identify the highest-cost, highest-friction components. Modernize them first. Reinvest the savings into the next phase.
Incremental Sprint-Based Delivery
At easy.bi, we use 14-day sprint cycles for every modernization project. Each sprint delivers a working, deployable increment. You see results in 2 weeks, not 18 months.
WeberHaus is the clearest example. Their legacy order processing system required manual workarounds for every edge case. Sales teams filled out paper forms. Office staff re-entered data into the system. Errors were common. Corrections were slow.
We rebuilt the system with Angular and Ionic, delivering working increments every 14 days. The result: 100% process digitization with full offline capability. Sales teams enter orders on tablets in the field. Data flows directly into the backend. The manual workarounds disappeared entirely.
Maintenance burden dropped 70% in the first year.
Siemens, Lekkerland, WeberHaus chose us
One integrated partner. Three core competencies. From insight to production, with no handover gaps.
Start with a Strategy CallWhat Does a Realistic Modernization Timeline Look Like?
Every legacy modernization follows a similar pattern, adjusted for the complexity of the existing landscape.
Weeks 1-4: Discovery and mapping. Document every system, every integration, every undocumented business rule.
This phase always uncovers surprises - the spreadsheet that 3 departments depend on, the middleware that one person built and nobody else can maintain, the manual process that exists only because the system cannot handle a specific edge case.
Weeks 5-8: Quick wins. Modernize the components with the highest cost-to-effort ratio. Replace manual CSV exports with API integrations. Eliminate the most painful workarounds. These early wins free up budget and build organizational confidence for the larger phases.
Months 3-6: Core system modernization. Rebuild the central system components using current architecture - Symfony, Angular, React, or whatever fits the domain. Each 14-day sprint delivers a working increment. Users start testing on real workflows immediately.
Months 6-12: Integration and optimization. Connect the modernized components to the broader ecosystem - SAP, Salesforce, Pimcore, payment systems. Optimize performance based on real production data. Decommission the legacy components one by one.
The key principle: you never run a sprint that does not deliver measurable value. No 6-month phases with nothing to show.
How Do You Build the Business Case for Modernization?
The CFO will not approve a modernization budget based on "our tech stack is old." You need numbers.
Start by calculating the full cost of your legacy systems - visible and hidden. Use the table above as a framework. Interview your engineering team about time spent on workarounds, manual processes, and maintenance tasks. Track how long feature requests take from approval to production.
Compare against industry benchmarks for companies on modern stacks.
Then project the savings from incremental modernization. Be conservative.
If your team spends 70% of their time on maintenance and modernization can reduce that to 40%, the freed capacity is the equivalent of hiring 1-2 additional senior engineers - without the recruiting timeline or salary costs.
Factor in the talent retention impact. If your annual senior engineer attrition rate is 25% and modernization reduces it to 10%, the savings in recruiting and onboarding costs alone can justify the first phase of the project.
Present the business case in language the CFO speaks: ROI timeline, payback period, and risk reduction. A typical incremental modernization project at easy.bi pays for itself within 9-12 months through reduced maintenance costs and improved team productivity. The talent retention savings accelerate that payback further.
WeberHaus saw a 70% reduction in maintenance burden in year one. Lekkerland's SAP migration eliminated an entire layer of custom middleware. These are not outlier results. They are the predictable outcome of systematic, incremental modernization.
Stop Maintaining. Start Building.
Every month you spend maintaining a legacy system is a month you are not building something new. For the complete guide on how to staff your modernization project - whether in-house, nearshore, or offshore - see The Build vs. Buy Decision: How to Staff Enterprise Software Projects in 2026.
Two articles that are essential reading alongside this one: Why Senior Engineers Leave - And How to Build Teams That Stay and In-House vs. Nearshore vs. Offshore: The Real Comparison. The hidden costs compound. The talent drain accelerates. The competitive gap widens.
easy.bi has delivered 100+ projects with a 98% client retention rate. Our 50+ engineers work in 14-day sprint cycles across 4 countries. We do not just modernize systems - we free your team to focus on growth instead of survival.
The first step is understanding your true legacy costs. The second step is a conversation with someone who has done this before - repeatedly and successfully.
References
- [1] McKinsey Technology Trends Outlook (2024). mckinsey.com
- [2] Stripe Developer Coefficient Report (2023).
- [3] LinkedIn Workforce Report / BLS (2024). linkedin.com
- [4] McKinsey (2023). 70% of digital transformations fail to reach their stated goals. mckinsey.com
- [5] CISQ / Synopsys (2023). The cost of poor software quality in the US was $2. it-cisq.org
Explore Other Topics
Ready to transform your business?
30-minute call with an engineering lead. No sales pitch - just honest answers about your project.
98% engineer retention · 14-day delivery sprints · No lock-in contracts
Related Reading
How to Run Two Systems at Once: The Parallel-Run Playbook
61% of migration projects exceed planned timelines. This playbook covers the strangler fig pattern, feature flags, data synchronization, and rollback strategies for running legacy and new systems in parallel.
Filip Kralj
What are the implications of modernizing legacy systems, in logistics and supply chain management today?
Enhance logistics with modern systems for improved agility, data visualization, and cash flow management, driving operational success and efficiency.
Andrej Lovsin
What strategies work well for updating legacy systems in the media and publishing industries?
Explore strategies for modernizing legacy systems in media, enhancing efficiency, and leveraging new technologies for a digital future.
Andrej Lovsin